

Most design space sections in a filing are a picture of a contour plot and a sentence that says "the design space is the shaded region". That does not survive a question. A reviewer wants to know which ranges you claim, what acceptance criterion defines them, and what happens at the edges. This article defines design space, NOR and PAR precisely, then shows with real worked results what a tighter specification costs you in operating window.
The three terms, defined
ICH Q8(R2) is short on numbers and long on definitions. Here they are, in the order a practitioner needs them.
Design space
is the multidimensional combination of input variables and process parameters that has been demonstrated to provide assurance of quality. It is multidimensional. It is not a list of per-factor ranges. Working within it is not a change; moving out of it is. The design space is what you propose and what the regulator approves.
PAR (Proven Acceptable Range)
is a characterised range of one parameter, for which operation within that range, *while holding other parameters constant*, will result in a product meeting the relevant quality attribute. That "while holding other parameters constant" clause is the whole point. A collection of PARs is univariate. It is not a design space, and Q8(R2) says so explicitly.
NOR (Normal Operating Range)
is the tighter band you actually run in day to day. It sits inside the PAR and inside the design space, with deliberate headroom so that ordinary process variability does not push you to the edge. NOR is a control-strategy decision, not a science decision.
The nesting is: setpoint sits inside NOR, NOR sits inside PAR, PAR is a univariate slice through the design space.
The same logic carries over to analytical procedures, where ICH Q14 describes a method operable design region for parameters such as mobile phase pH, gradient slope and column temperature. For an HPLC method that region only makes sense once the stationary phase is fixed, which is why HPLC column selection comes before any robustness study.
Where the numbers come from
Two routes to a defensible region. Designed experiment plus response surface: run a structured design, fit an explicit model, interrogate the surface. Best when you can afford the runs and want confidence intervals you can defend. Model over existing process data: fit and cross-validate models on historical runs, derive ranges by Monte Carlo. Best when the runs already happened.
Below, one worked example of each. Every number is taken unchanged from the analysis.
Worked example 1: PAR from a response surface
A three-factor catalytic step: temperature, catalyst loading, time, response = yield.
Our design-of-experiments analysis built an 18-run central composite design (8 factorial, 6 axial, 4 centre points), rotatable with alpha = 2.236. The fitted quadratic response surface gives R-squared 0.9988, adjusted 0.9974, every term significant at p < 1e-4.
The optimum sits at 91.2 °C, 3.76 mol% catalyst, 9.7 h, predicting 93.5% yield with a 95% confidence interval of 93.16 to 93.76% and a prediction interval of 92.73 to 94.20%. Note the gap between the two intervals: the CI is about the mean response, the PI is about the next single batch. Quote the PI when someone asks what one run will do.
Then 10,000 Monte Carlo points were sampled across the factor space at two different acceptance criteria.
| Acceptance criterion | Temperature | Catalyst | Time | Fraction of space passing |
|---|---|---|---|---|
| Yield >= 90% | 69.9 to 112.1 °C | 1.4 to 6.0 mol% | 4.6 to 14.5 h | 10.6% |
| Yield >= 92% | 80.5 to 101.2 °C | 2.55 to 5.01 mol% | 7.1 to 12.0 h | 3.05% |
Two percentage points of extra yield specification cut the acceptable temperature window from 42.2 °C wide to 20.7 °C wide, the catalyst window from 4.6 mol% wide to 2.46 mol% wide, and the passing fraction of the sampled space from 10.6% to 3.05%, a 3.5-fold reduction. Nothing about the chemistry changed. Only the line you drew changed. That is the number to put in front of whoever is proposing the tighter internal limit: a spec is a purchase, and the currency is operating window.
Two practitioner notes. Residual diagnostics on the same fit gave Shapiro-Wilk at p 0.036 and flagged run 9 at Cook's D 0.277 as a leverage point: run the diagnostics before you quote ranges from a model with an unexamined influential point. And check that the acceptance criterion actually took effect: with none in place, 100 percent of the factor space passes, which looks like a wonderful result and is not one.
Worked example 2: NOR from process data
Different situation: 30 runs of a Pd-catalysed coupling already exist (temperature, catalyst loading, base equivalents, time, giving yield and purity). No new experiments budgeted.
The data check rated data quality good, with no missing values and no duplicates. The modelling returned cross-validated Q-squared 0.80 for yield and 0.72 for purity, both passing Breusch-Pagan heteroscedasticity checks at p 0.28 and 0.21.
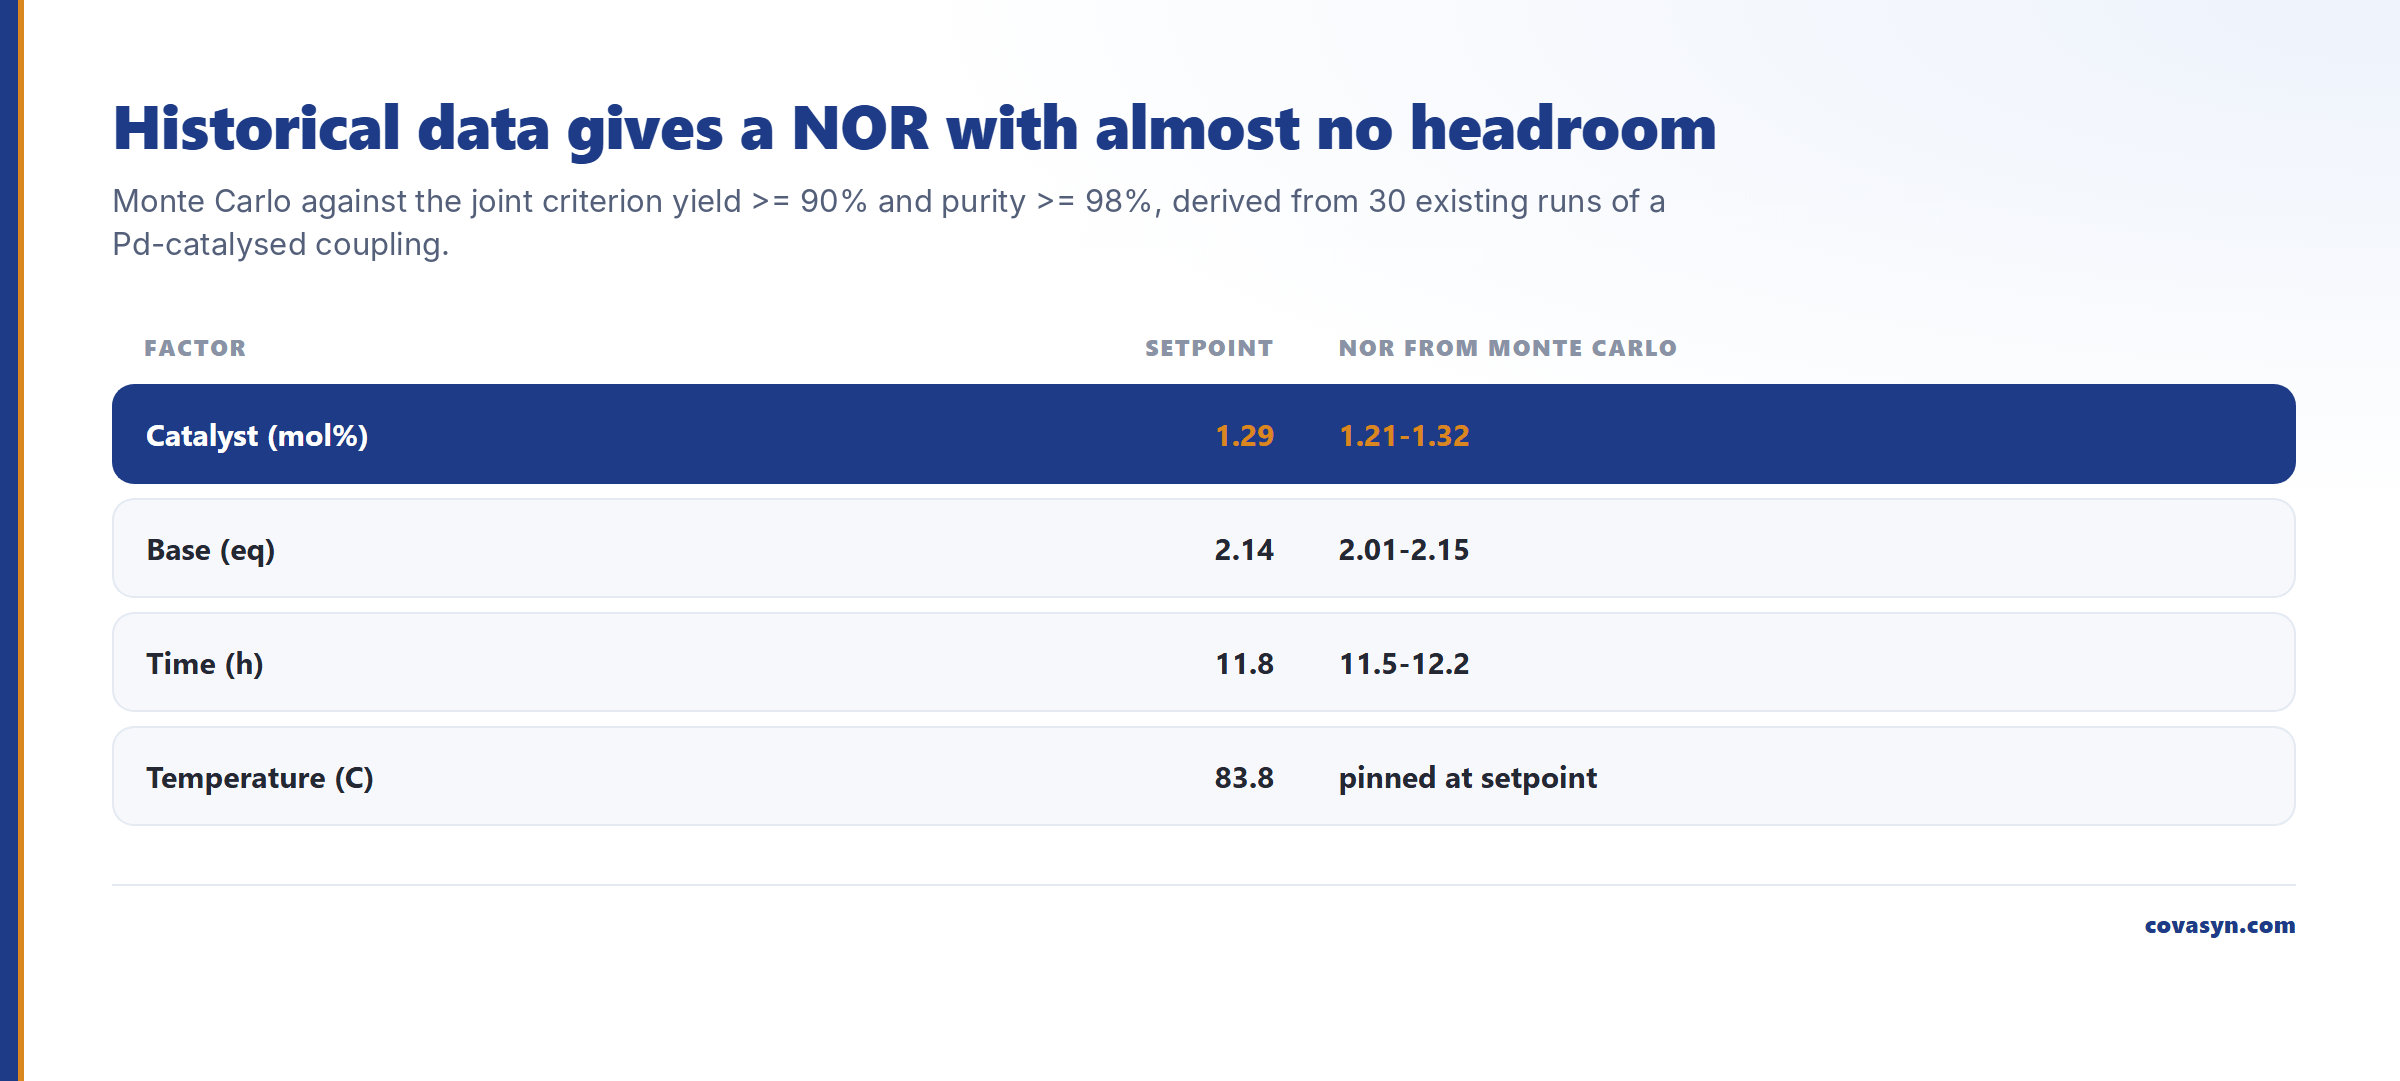
The optimisation returned a setpoint of 83.8 °C, 1.29 mol% Pd, 2.14 eq base, 11.8 h, predicting 91.0% yield at 98.0% purity, desirability 0.68, feasibility probability 0.96, with the hard purity >= 98 constraint satisfied (violation 0.0).
The NOR per factor was then derived by Monte Carlo against the joint criterion yield >= 90% *and* purity >= 98%:
- catalyst 1.21 to 1.32 mol%
- base 2.01 to 2.15 eq
- time 11.5 to 12.2 h
- temperature effectively pinned at the setpoint
Catalyst is plus or minus about 0.055 mol% around the setpoint. The analysis flagged the joint 90/98 target as aggressive, and that flag is the useful finding: this process, as understood from these 30 runs, has almost no simultaneous headroom on yield and purity. The correct response is more experiments in the right place, or a renegotiated joint spec, not a NOR of 1.21 to 1.32 mol% in a batch record. Same Monte Carlo machinery as example 1, but a joint two-response criterion collapses the window far harder than either spec alone. Joint specifications multiply, they do not average.
How to actually set NOR inside PAR
A workable sequence:
1. Establish the acceptance criterion first, in writing, before you look at any ranges. Yield >= 90% and yield >= 92% are different projects. 2. Derive the PAR from the fitted model at that criterion (example 1). 3. Measure your real process variability. The capability analysis returned I-MR control limits of 72.3 to 98.9% with 0 of 8 Nelson rules tripped and zero out-of-spec on the coupling dataset above. That spread is what your NOR has to absorb. 4. Set the NOR so that normal variability stays inside the PAR with margin, then confirm the edges experimentally. 5. Only then propose the design space, and propose it as a region, not as a stack of independent ranges.
Step 3 is where "in control" and "capable" separate. That same process had a mean yield of 85.6% against a 90% target: perfectly stable, and 4.4 points short. Stability tells you nothing about whether the NOR you drew is achievable.
Honest limits
What this does not tell you:
- A Monte Carlo design space is a model prediction, not evidence. The 10,000-sample pass rates above describe the fitted surface. The edges of a claimed region still need confirmation runs. Q8 wants demonstrated assurance of quality.
- Simulated responses in example 1. The 18-run CCD is a real design and every result (R-squared, optimum, intervals, ranges, diagnostics) is genuinely computed, but the per-run yields were simulated from a quadratic surface with noise to stand in for lab measurements. The example demonstrates the method, not a specific chemistry.
- The process dataset is representative, not a customer batch. 30 rows of a Pd-coupling surface. Q-squared 0.80 is a decent model on 30 runs; it is not a validated one.
- No Cpk claim. In that run the capability analysis had no spec limits to work with and emitted no numeric Cpk. It reported statistical control only.
- Per-factor ranges hide correlation. PARs are univariate by definition. If your factors interact, and in example 1 they do, the true acceptable region is not the box formed by the individual ranges.
- This is decision support. It tells you where to run the confirmation experiments and what a spec change costs. It does not replace validated wet-lab work, and it is not a filing.
Frequently asked questions
What is the difference between NOR and PAR?
A PAR (Proven Acceptable Range) is the characterised range of one parameter over which product quality is still met, holding other parameters constant. A NOR (Normal Operating Range) is the narrower band you actually operate in day to day, set inside the PAR with deliberate headroom so routine process variability does not reach the edge. PAR comes from experimental and model evidence; NOR is a control-strategy choice.
Is a set of proven acceptable ranges a design space?
No. ICH Q8(R2) is explicit that a combination of PARs is not a design space, because each PAR is established with the other parameters held constant. A design space is multidimensional and accounts for interactions. If your factors interact, the true acceptable region is not the rectangular box formed by stacking individual PARs, and a reviewer can ask you to show that.
How much operating window does a tighter specification cost?
It can cost far more than the spec change suggests. In the example above, 10,000 Monte Carlo samples returned a temperature PAR of 69.9 to 112.1 °C at yield >= 90%, shrinking to 80.5 to 101.2 °C at yield >= 92%. The fraction of the sampled space passing fell from 10.6% to 3.05%, a 3.5-fold reduction, for two percentage points of yield.
How many experiments do I need to define a design space?
For three factors, an 18-run central composite design (8 factorial, 6 axial, 4 centre) was enough to fit a quadratic model at R-squared 0.9988 in the example above. Centre-point replication is what gives you the pure-error estimate and therefore the confidence intervals. Fewer runs is possible with a definitive screening design, but you trade curvature resolution for run count.
Can I derive a design space from historical process data instead of a DoE?
Partly. With 30 historical runs, the modelling reached cross-validated Q-squared 0.80 for yield and 0.72 for purity, and the Monte Carlo analysis produced per-factor NORs. But historical data is unbalanced and correlated, so the resulting window is often very narrow, and the joint 90% yield plus 98% purity criterion came back flagged as aggressive. Treat it as process understanding that tells you which experiments to run next.
Why did my design space come back as the full factor range?
Usually a missing or misapplied acceptance criterion. With no effective specification limit, every point passes and the analysis returns the untrimmed range, which looks like a perfect result. Any design space reported as 100% passing over the whole factor space should be treated as a configuration error until proven otherwise.
Related reading
Evaluation for this topic
We evaluate this for your lab.
- Multi-objective optimisation, robustness, drift.
- Design of Experiments, RSM, templates.