

Someone asks you in a review meeting whether the process is capable, and you show a control chart with no violations. That answers a different question. A process can sit perfectly inside its control limits, trip zero alarm rules, and still deliver product that misses the number you actually care about. Control charts describe the process against itself. Capability indices describe the process against your specification.
The two questions, kept apart
In control
means the process is predictable. Variation looks like common cause only: no shifts, no trends, no points beyond the limits, no runs. You test this with a control chart and a rule set (Western Electric, or the eight Nelson rules). Control limits come from the data itself, usually mean +/- 3 sigma, where sigma is estimated from within-subgroup variation (for individuals data, from the mean moving range).
Capable
means the process meets a requirement someone else set. You test this by comparing the process spread and location against the specification limits. Control limits are an output of the process. Spec limits are an input from the product. They are not the same numbers and they must never be drawn on the same chart as if they were.
| In control | Not in control | |
|---|---|---|
| Capable | Steady state. Monitor and leave alone. | Meets spec today by luck. Fix the special causes before you trust it. |
| Not capable | Predictably wrong. Needs process change, not more monitoring. | The common starting point. Stabilise first, then measure capability. |
The bottom-left cell is the one people misread. A predictable process that misses target will keep missing target. No amount of tightened monitoring will move it.
What Cpk and Ppk actually compute
Both indices express the distance from the process mean to the nearest specification limit, in units of three standard deviations.
``` Cp = (USL - LSL) / (6 * sigma_within) Cpk = min[ (USL - mean), (mean - LSL) ] / (3 * sigma_within)
Pp = (USL - LSL) / (6 * sigma_overall) Ppk = min[ (USL - mean), (mean - LSL) ] / (3 * sigma_overall) ```
The only structural difference is the sigma:
- Cpk uses within-subgroup (short-term) sigma, estimated from moving ranges or subgroup ranges. It answers: how good could this process be if the between-batch drift were removed? It is potential capability.
- Ppk uses overall (long-term) sigma, the ordinary sample standard deviation of everything you measured. It answers: what is the customer actually getting? It is performance.
Cp and Pp ignore centering, so they only tell you whether the spread would fit if the process were perfectly centred. Cpk and Ppk carry the centering penalty. If Cp is high and Cpk is low, you have a centering problem, not a variability problem, and that is usually the cheaper fix.
A large gap between Cpk and Ppk is itself a finding: it means between-batch variation is large relative to within-batch variation. Raw material lots, campaign breaks, operator or shift effects, seasonal utilities. Chasing within-batch noise will not close that gap.
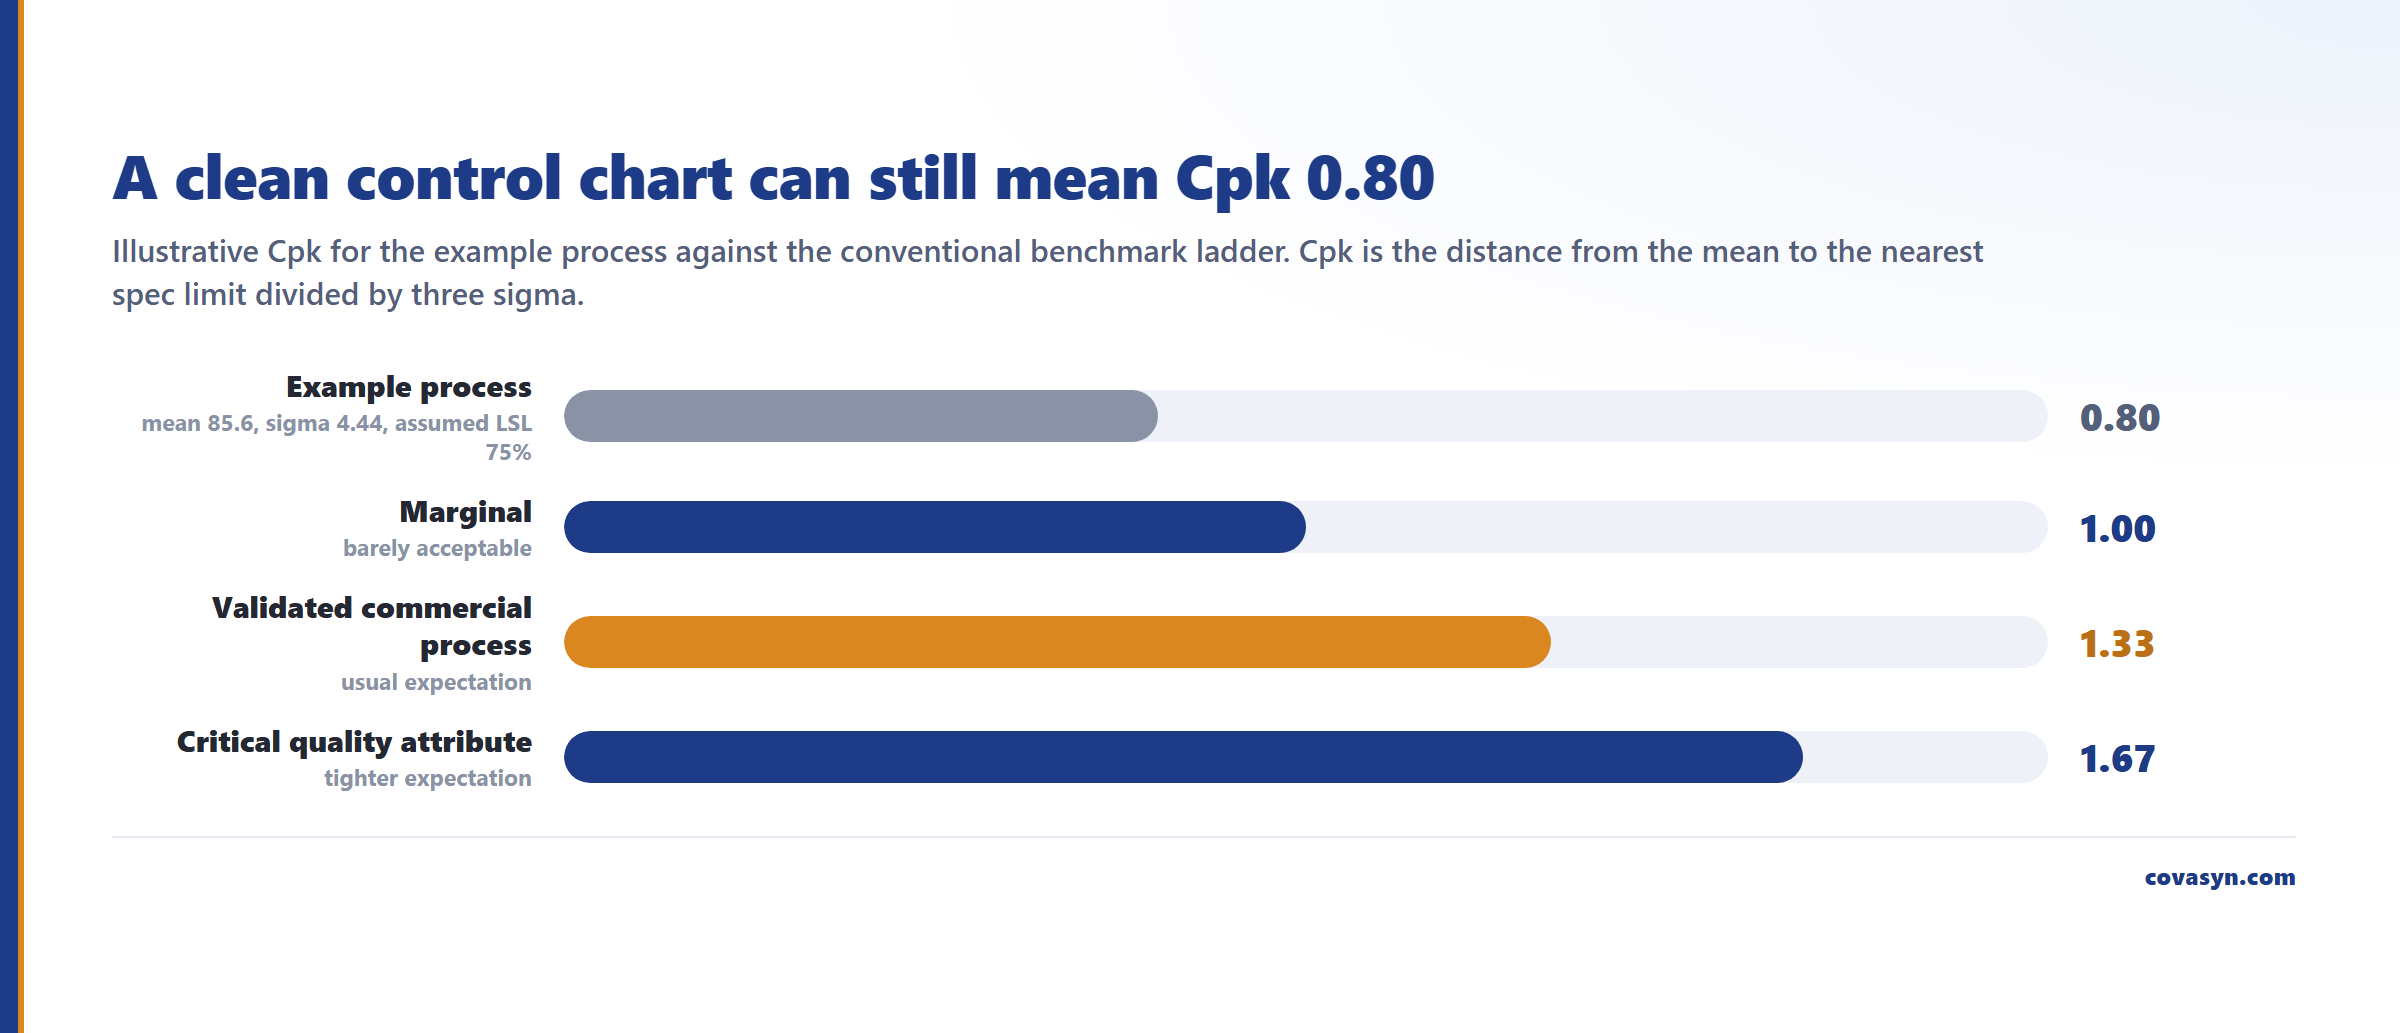
Conventional benchmarks: Cpk >= 1.33 is the usual expectation for a validated commercial process, Cpk >= 1.00 is marginal, and >= 1.67 is used for critical attributes. These are industry convention, not a numeric requirement written into ICH Q8 to Q11 or the FDA process validation guidance. The guidance asks you to demonstrate a state of control and sustained capability; the 1.33 number is how the industry operationalises that.
A worked example: stable, and 4.4 points short
The example below comes from our process analysis of a representative 30-run Pd-catalysed coupling dataset (temperature, catalyst loading, base equivalents, time, against yield and purity). The inputs are illustrative process data, not a specific customer batch record. The results are calculated from those data.
For yield, the result was:
| Statistic | Value | Meaning |
|---|---|---|
| Mean | 85.6% | Process centre |
| Estimated sigma | 4.44 | Estimated process sigma |
| I-MR control limits | 72.3% to 98.9% | Individuals chart, mean +/- 3 sigma |
| Nelson rules violated | 0 of 8 | No special-cause signal |
| Out-of-spec points | 0 | No recorded OOS |
| Target | 90% | The number the project wants |
The limits and the sigma reconcile exactly: (98.9 − 72.3) / 6 = 4.43. That is a useful sanity check to run on any capability output you are handed.
So what do you tell the review meeting?
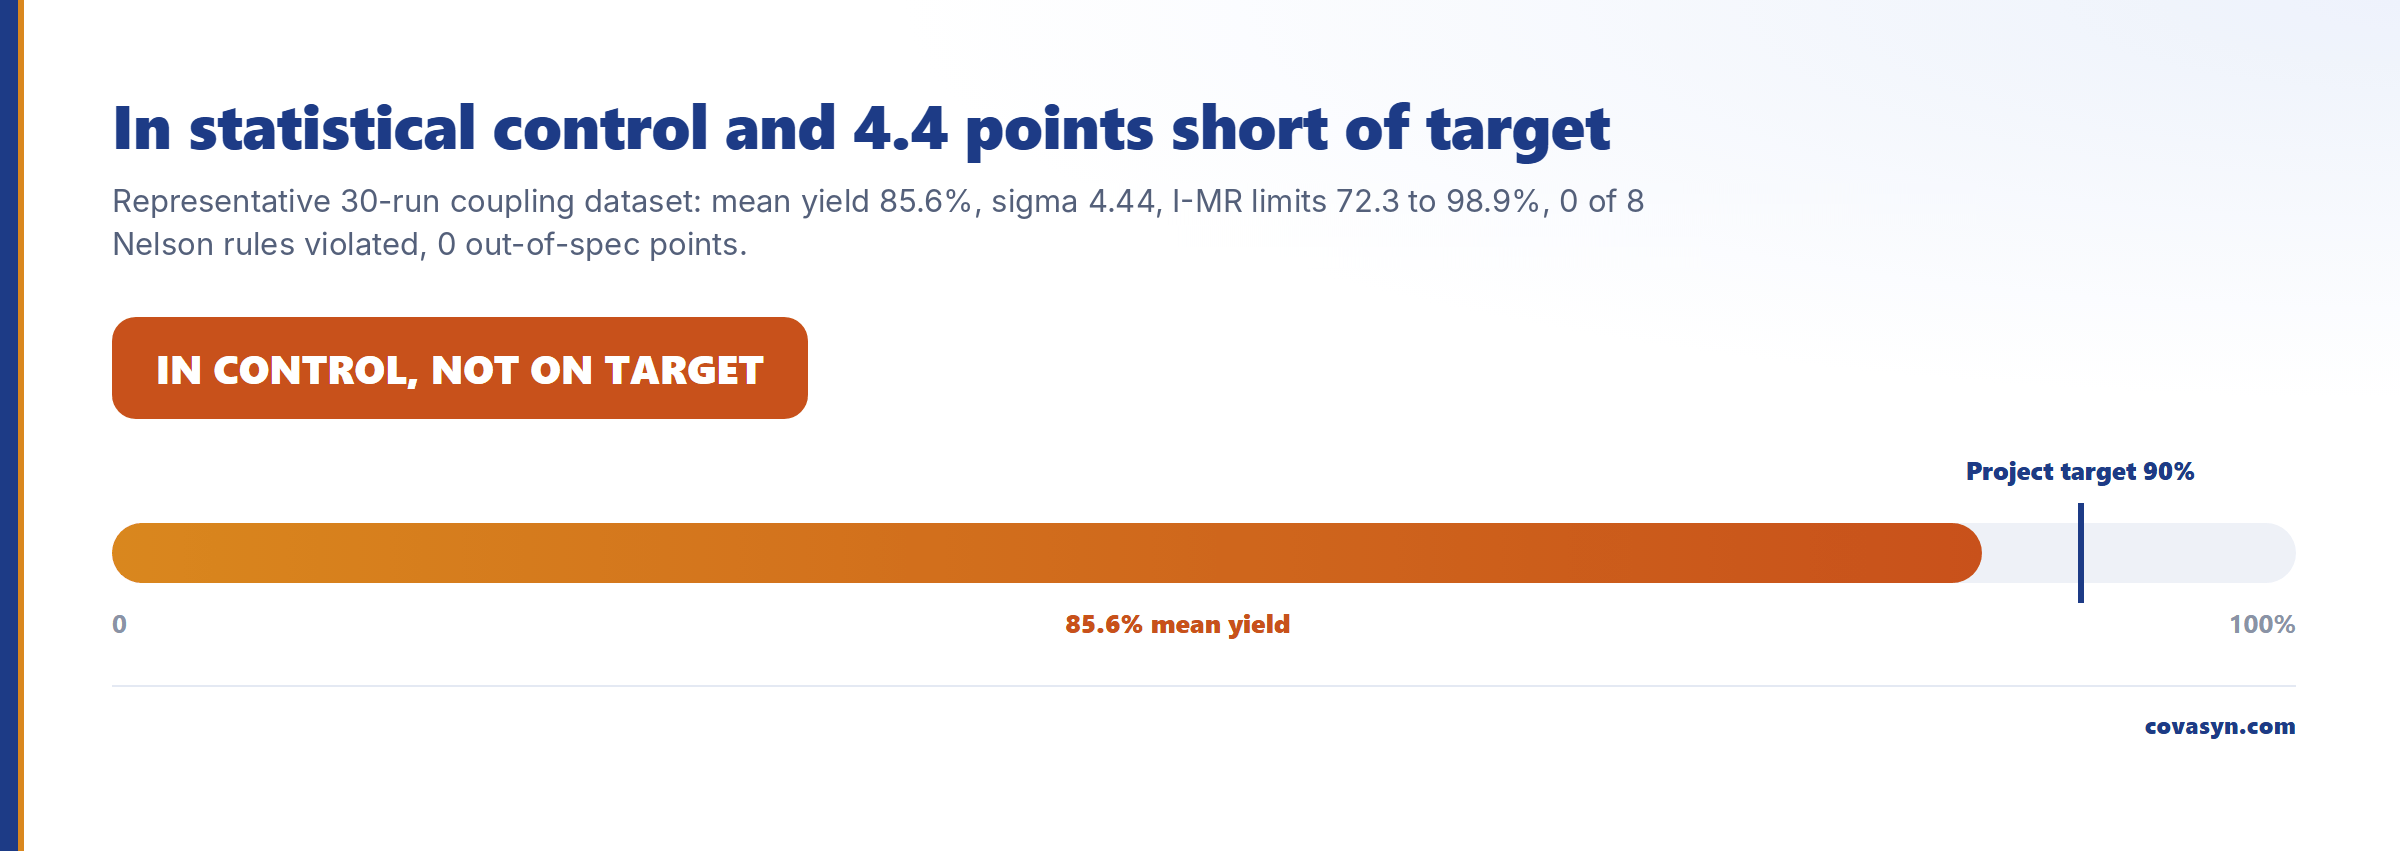
The process is in statistical control. Zero of eight Nelson rules fired across 30 runs, no out-of-spec results. It is predictable, and you can forecast it.
The process is not on target. It sits at 85.6% against a 90% goal, a gap of 4.4 points, which is roughly one process sigma. Predictable and short is still short. Monitoring harder will not move the mean; changing the process will. In this dataset, our optimisation gave a setpoint of 83.8 °C, 1.29 mol% Pd, 2.14 eq base and 11.8 h with a predicted 91.0% yield at 98.0% purity (desirability 0.68, 96% feasibility, hard purity >= 98 constraint satisfied). That is the direction of the fix: move the mean, then re-measure capability.
The honest part: this run did not emit a Cpk
The analysis gives the SPC evidence above but no numeric Cpk or Ppk, because the yield attribute had no lower and upper specification limits set. That is correct. A capability index without a spec limit is not a conservative estimate; it is undefined. 90% was a project target, not a registered specification, and quietly substituting one for the other is exactly how capability numbers end up indefensible in a review.
If you wanted the index, you supply the spec. With this process (mean 85.6, sigma 4.44) and a hypothetical LSL of 75% and no upper limit, the arithmetic would be (85.6 − 75) / (3 * 4.44) = 0.80. That figure is illustrative arithmetic on an assumed spec limit, not a result of the analysis, and it is shown only to make the mechanics concrete. Cpk = 0.80 would mean an incapable process even though the control chart is clean, which is the whole point of the article.
What capability indices do not tell you
- They assume normality. Cpk on skewed or bounded data (impurity levels near zero, yields near 100%) overstates or understates the tail badly. Check the distribution, or use a non-normal capability method, before quoting a number.
- They assume stability. Computing Cpk on an out-of-control process produces a number with no forecasting value. Stabilise first. This ordering is not optional.
- They are sensitive to n. A Cpk from 20 batches carries a wide confidence interval. Quote the sample size, and ideally the interval, next to the point estimate.
- They say nothing about cause. Cpk = 0.8 tells you there is a problem, never which parameter to change. That is a separate question, answered by sensitivity analysis or a design space study, not by the index.
- Measurement error is inside the number. If the analytical method contributes meaningfully to total variation, part of your "process" variability is the assay.
- They are decision support, not a filing. Anything going into a PPQ or CPV report needs your validated data, your approved specs and your quality unit. Our analysis triages and prioritises; it does not sign anything.
Practical order of operations
1. Confirm the specification limits are the registered ones. Target is not spec. 2. Plot the data in time order first. Control chart before index, always. 3. Resolve special causes before computing anything. 4. Check the distribution shape and the measurement system. 5. Compute Cpk and Ppk together. The gap between them is the between-batch signal. 6. If Cpk is low but Cp is high, fix centering. If both are low, reduce variability or widen the justified range. 7. Re-measure after the change. Capability is a moving property, not a certificate.
Frequently asked questions
What is the difference between Cpk and Ppk?
Cpk and Ppk use the same formula but a different sigma. Cpk uses within-subgroup (short-term) sigma, estimated from moving ranges or subgroup ranges, and describes potential capability. Ppk uses overall (long-term) sample standard deviation and describes actual delivered performance. Ppk is normally the lower of the two. A large gap between them indicates substantial between-batch variation, such as raw material lot or campaign effects.
Can a process be in control but not capable?
Yes, and it is common. In control means the process is predictable, with no special-cause signals on the control chart. Capable means it meets the specification. Our analysis of a representative coupling dataset returned a yield mean of 85.6% with zero of eight Nelson rules violated and zero out-of-spec points, against a 90% target. Predictable, stable, and 4.4 points short.
What Cpk value is required in pharmaceutical manufacturing?
Cpk >= 1.33 is the industry convention for a validated commercial process, with 1.67 used for critical quality attributes and 1.00 treated as marginal. These thresholds are convention, not numbers written into ICH Q8 to Q11 or the FDA process validation guidance, which instead require a demonstrated state of control and sustained capability. Your quality agreement or validation master plan sets the number that applies to you.
Why was there no Cpk number in the example?
Because no specification limits were defined for that attribute. Cpk is the distance from the process mean to the nearest spec limit divided by three sigma; with no limit, the index is undefined rather than merely uncertain. In the example described here, no limits were set for yield, so the analysis contained the SPC evidence (mean, sigma, control limits, Nelson rule results) and no capability index.
Should I put specification limits on a control chart?
No. Control limits are calculated from the process and describe what it does. Specification limits come from the product requirement and describe what it must do. Plotting both on one chart invites the reader to treat spec limits as alarm thresholds, which hides genuine special-cause signals inside a wide spec and produces false alarms inside a tight one. Keep the control chart and the capability analysis separate.
How many batches do I need for a meaningful Cpk?
There is no single answer, but a point estimate from fewer than roughly 25 to 30 data points carries a confidence interval wide enough to change the decision. Always report n alongside the index, and prefer a confidence interval to a bare number. A Cpk of 1.35 from 20 batches and a Cpk of 1.35 from 200 batches are not the same claim.
Related reading
Evaluation for this topic
We evaluate this for your lab.
- Multi-objective optimisation, robustness, drift.