
Most failed DoE studies do not fail in the lab. They fail on the planning sheet, when someone picks a run count that fits the week and a factor range that feels safe. The runs get done, the ANOVA comes back with nothing significant, and the team writes "temperature has no effect" into the report. That conclusion is usually wrong. The design simply never had the resolution to see it.
Power analysis is the calculation that tells you this before you burn material.
What power actually means
Power is the probability that your design detects an effect of a given size, if that effect is really there. It depends on four things:
- Number of runs (n)
- Number of model terms you intend to fit (each term you estimate costs a degree of freedom)
- Effect size, expressed in units of the residual standard deviation sigma
- Alpha, the significance level you will test at (0.05 by convention)
The unit that trips people up is the third one. Effect size is not "5 percentage points of yield". It is the effect divided by your assay and process noise. A 5-point yield shift with sigma = 5 is a 1.0 sigma effect. The same 5-point shift with sigma = 10 is 0.5 sigma, and it is far harder to see.
Worked example: a 13-run screening design
Take a Suzuki-type aryl halide coupling with six factors: temperature, catalyst loading, base equivalents, water fraction, time, boronic acid equivalents.
For six factors and a screening goal, CovaSyn's design-of-experiments analysis suggests a definitive screening design at 13 runs, with the classical fractional factorial listed as the alternative at 32 runs. The DSD estimates main effects plus curvature in 13 runs, so that is what we plan around.
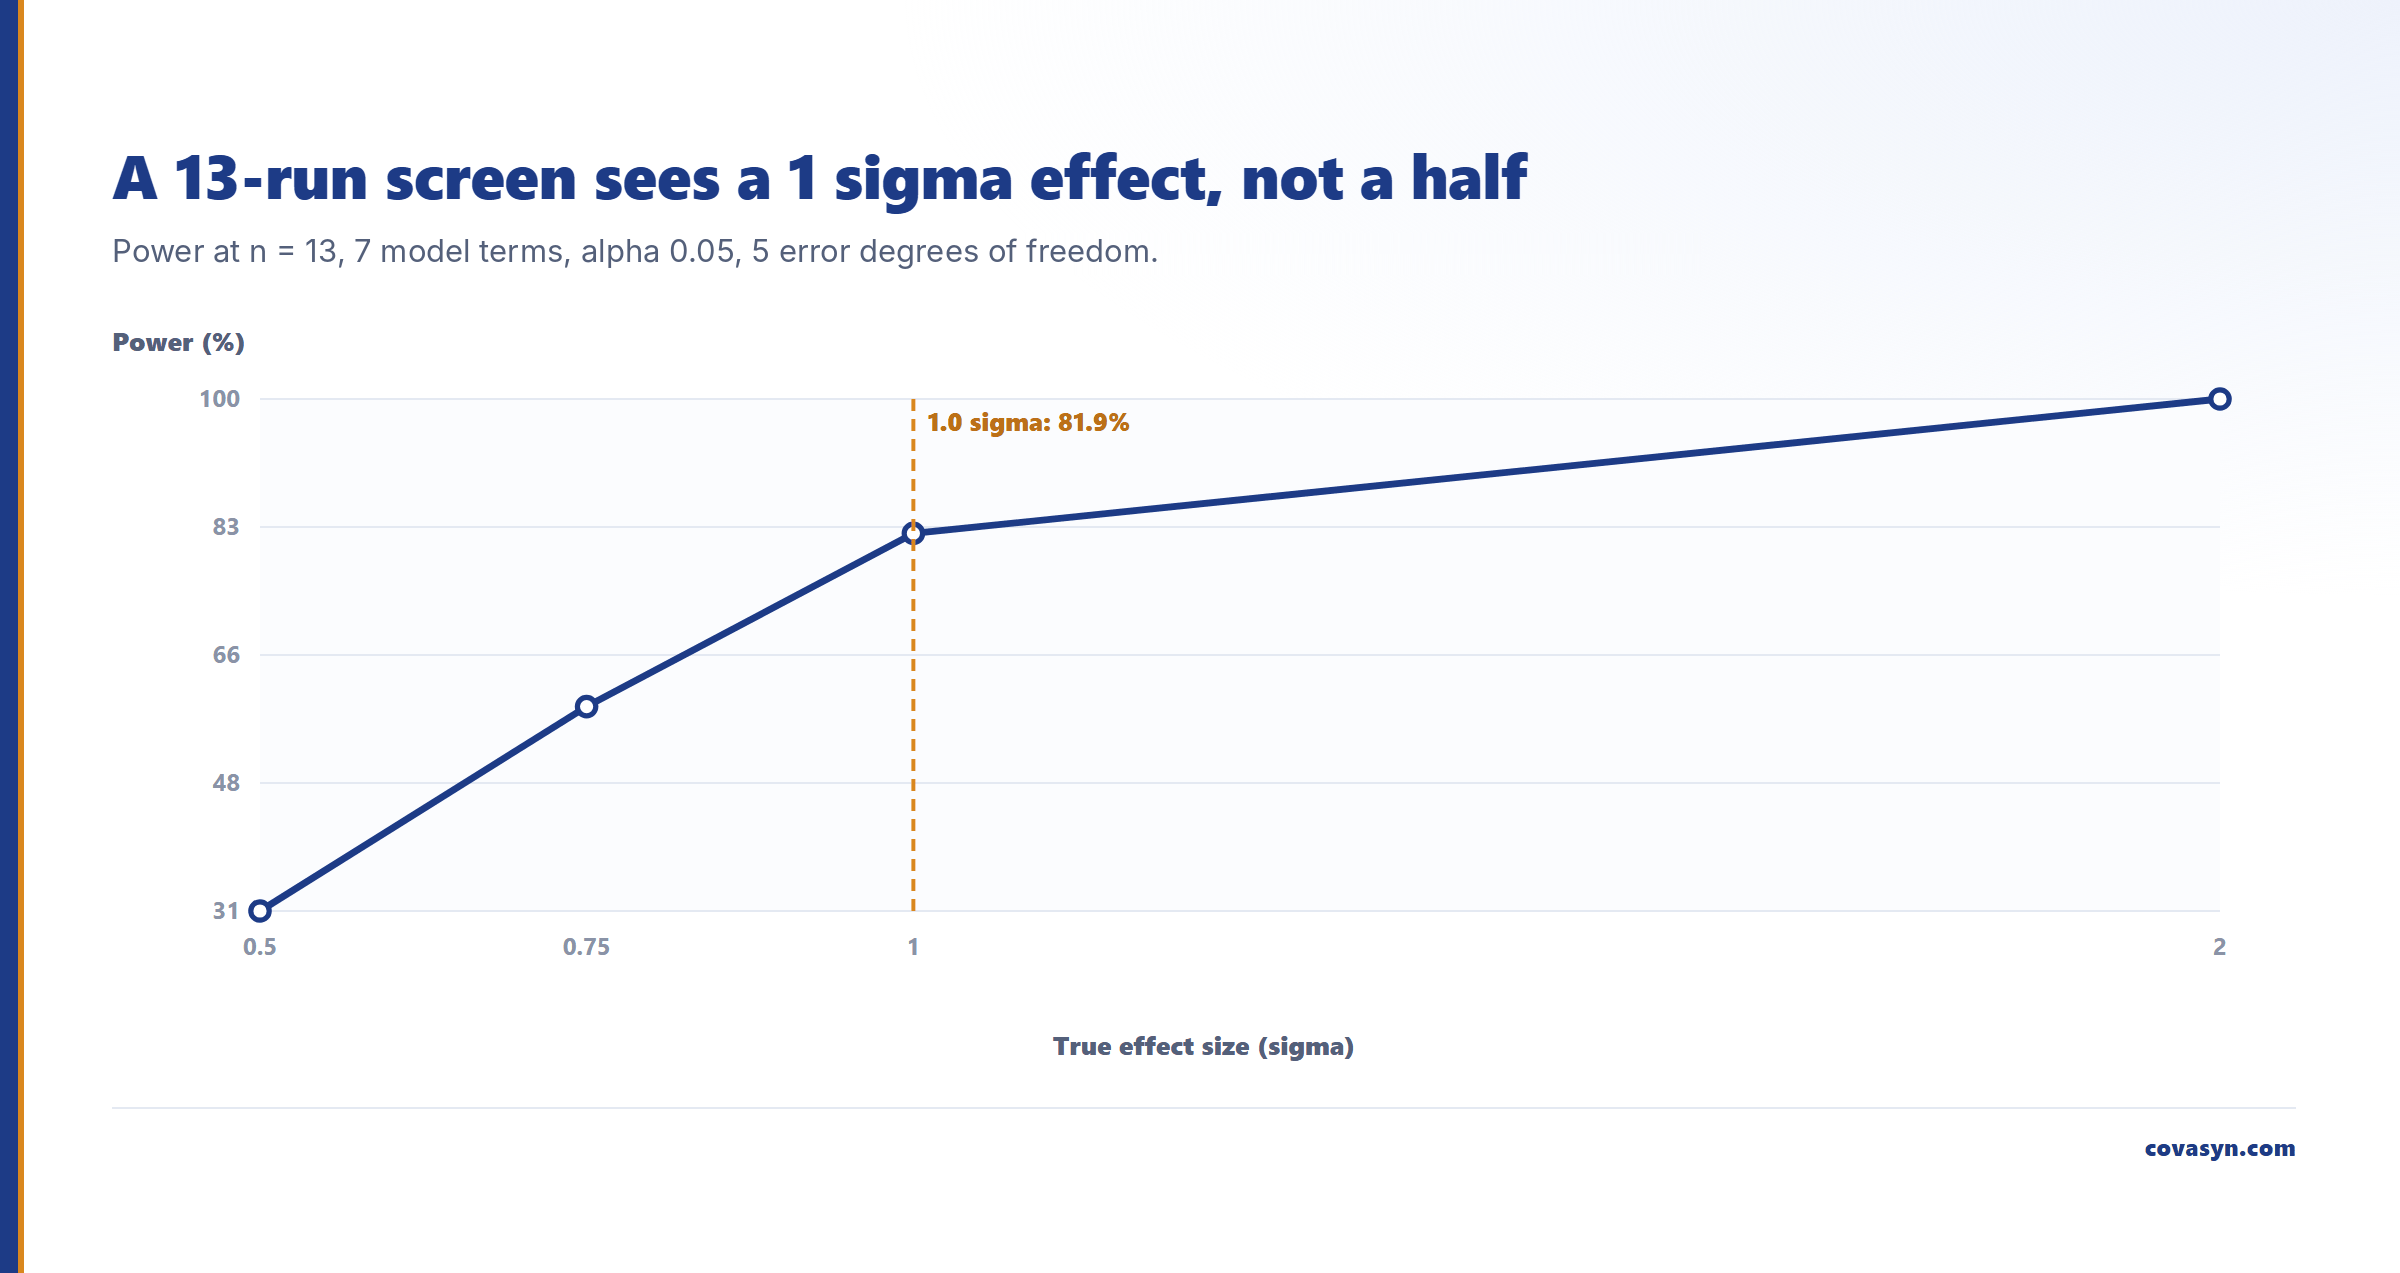
Now the question that matters: what can 13 runs actually see? The power calculation for 13 runs, 7 model terms, α = 0.05 and a residual variance of 1:
| Effect size | Power | Noncentrality | Error df |
|---|---|---|---|
| 0.5 sigma | 31.1% | 3.25 | 5 |
| 0.75 sigma | 58.6% | 7.31 | 5 |
| 1.0 sigma | 81.9% | 13.0 | 5 |
| 2.0 sigma | 99.98% | 52.0 | 5 |
All four rows come from the same calculation; only the effect size changed.
Read the first and third rows together. Thirteen runs is a good design for an effect the size of your noise: it finds it about four times in five. For an effect half the size of your noise, it finds it about once in three. Two thirds of the time, a real 0.5 sigma effect walks straight past you and gets written up as "not significant".
The part nobody puts on the planning sheet: factor range
Here is the link that makes power a design decision and not just a sample-size calculation.
For a factor with an approximately linear effect, the effect you observe across the design is proportional to the range you span. Run temperature from 60 to 80 °C and you see the full 20-degree effect. Run it from 70 to 75 because that is where the process "normally sits" and you see a quarter of it. The physics did not change. Your standardised effect size did.
So in the table above, moving from row three to row one is not a different molecule. It can be the same factor, studied over half the range. The design that had 82% power now has 31%.
That is why "we kept the ranges tight to stay near the target" is the single most expensive decision in screening. It does not make the study safer. It makes the study uninformative, and it converts a real effect into a false negative that gets locked into the process understanding.
If a factor genuinely cannot be moved further for safety or material reasons, that is a legitimate constraint. But then you should know, before you start, that you are running a 31% study and plan the run count accordingly.
What to do when the power comes back low
Four levers, in rough order of cost effectiveness.
1. Widen the factor range. Costs no extra runs. Usually doubles or triples the standardised effect. Bounded by chemistry, safety and what you are willing to run. 2. Reduce sigma. Tighter analytical method, better sampling, blocking on batch or operator. Cutting sigma in half doubles every standardised effect size, exactly like doubling the range. 3. Cut model terms. Every term you fit takes a degree of freedom. At n = 13 with 7 terms you have only 5 error df, which is why the t-critical value is punishing. Drop the terms you do not intend to interpret. 4. Add runs. The last resort, because it scales badly.
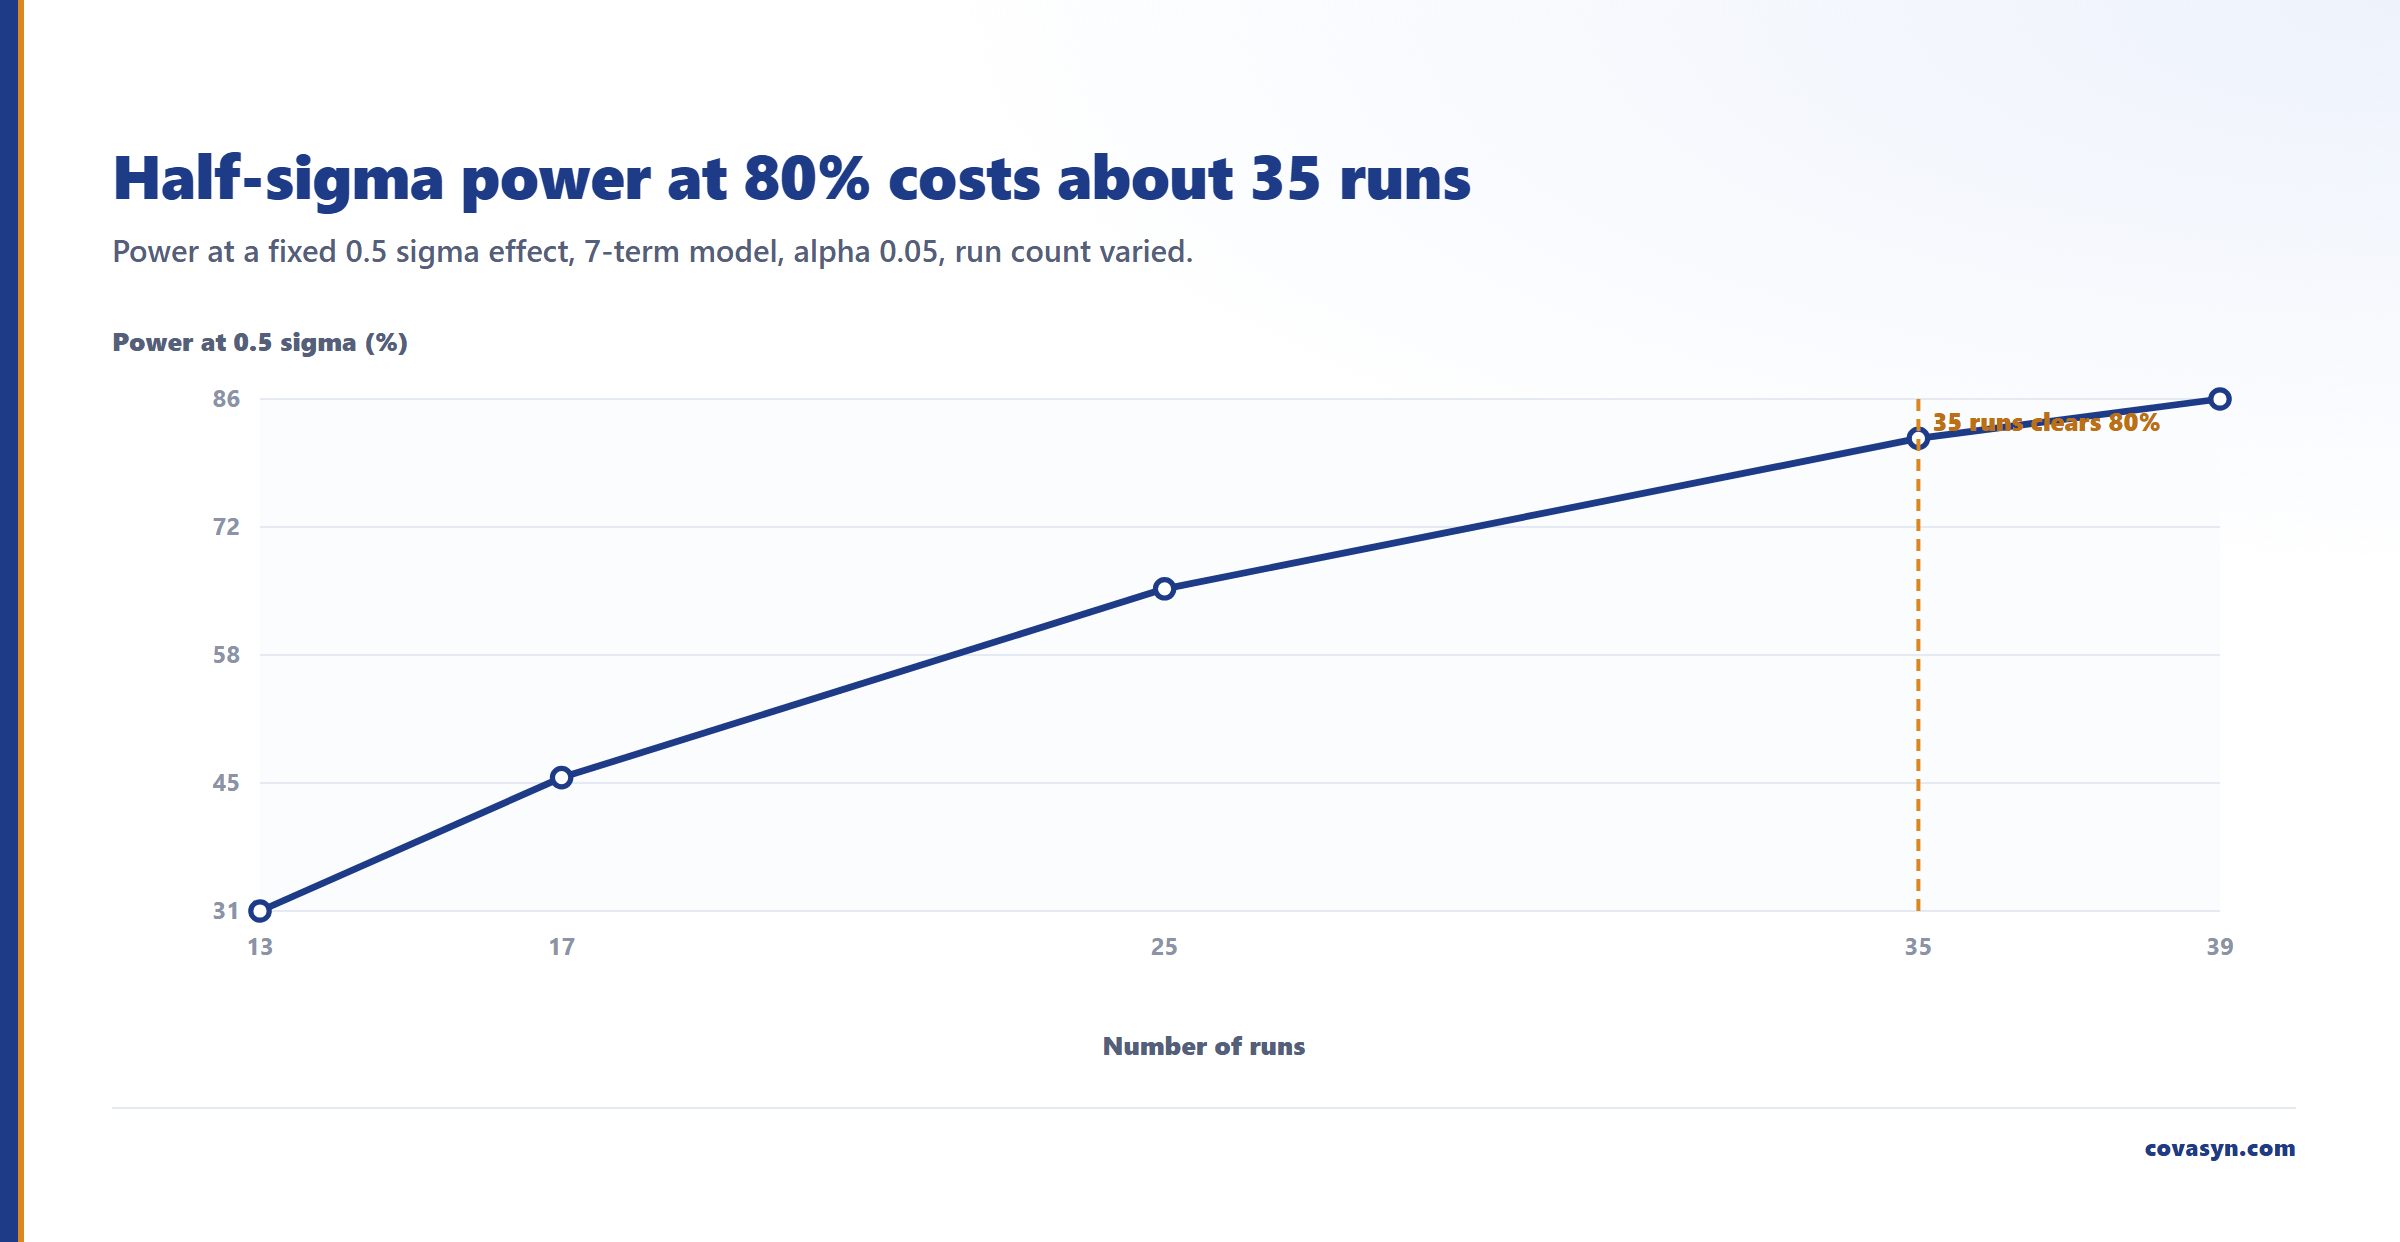
Lever 4 scales badly in a way worth quantifying. Holding 7 terms and a 0.5 sigma effect, the power calculation gives:
| Runs | Power at 0.5 sigma |
|---|---|
| 13 | 31.1% |
| 17 | 45.3% |
| 25 | 65.4% |
| 35 | 81.4% |
| 39 | 85.6% |
To reach conventional 80% power for a half-sigma effect you need roughly 35 runs, nearly three times the screening design. Doubling the factor range, where the chemistry allows it, gets you to 82% at 13 runs instead. That is the trade the planning sheet should be showing.
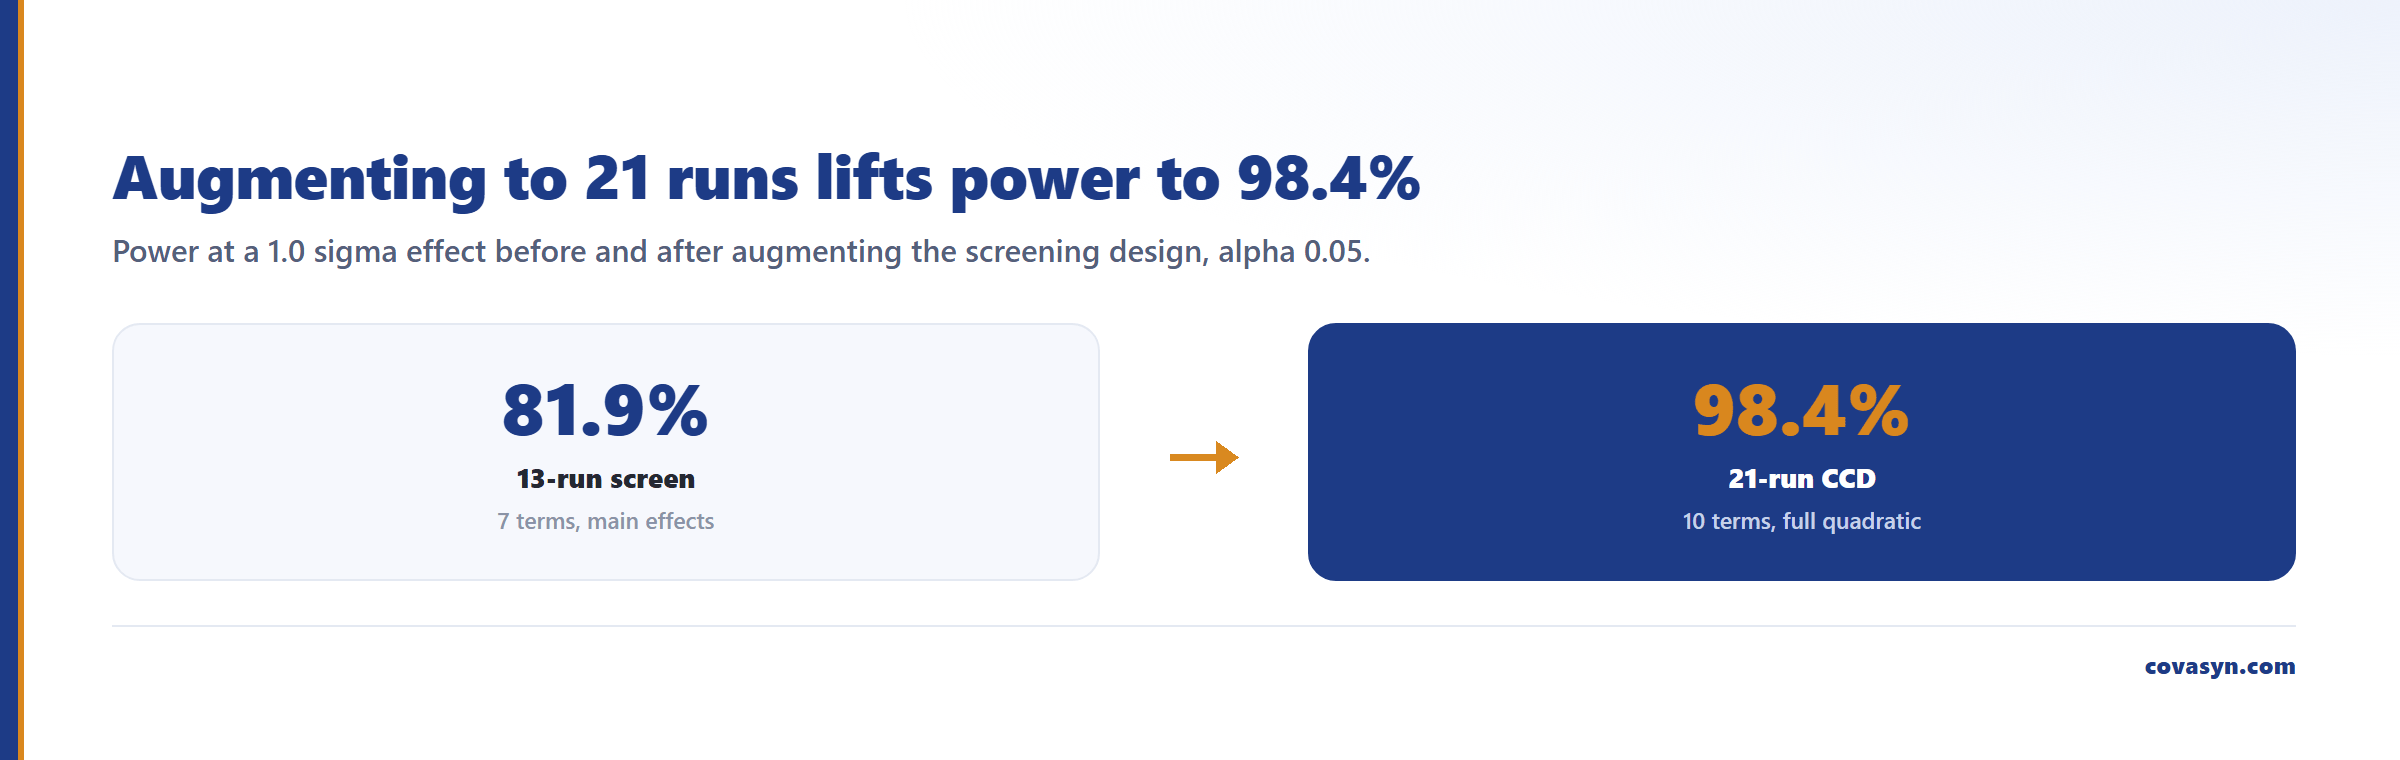
The same calculation covers the follow-up stage. If you augment the 13-run DSD to a 21-run central composite design on the three surviving factors and fit a full quadratic (10 terms), 21 runs and 10 terms give 98.4% power at 1.0 sigma. Adding runs to an existing design instead of restarting is the cheap path, and the power calculation confirms it lands where you need it.
Honest limits of a power calculation
- It is a planning estimate, not a measurement. Every number above assumes you can state sigma in advance and that the effect is roughly linear over the range. If your sigma guess is off by 30%, so is your power curve.
- It assumes the model you named. Power at 7 terms says nothing about a design that ends up fitting 12 terms because the residuals forced you to.
- It does not check the design is estimable. A design can have adequate power on paper and still confound two factors you care about. Aliasing is a separate check.
- Post-hoc power on your own p-value is close to useless. Observed power computed from the observed effect is a monotone function of the p-value, so it adds no information. A post-hoc calculation is useful for planning the *next* study from a measured sigma, not for defending a null result in the current one.
- None of this replaces subject-matter judgement. Power tells you what your design can resolve. It cannot tell you whether the factor matters to the patient, the plant, or the filing.
Frequently asked questions
What is power analysis in design of experiments?
Power analysis calculates the probability that a planned experimental design will detect an effect of a given size, assuming that effect is real. It depends on the number of runs, the number of model terms being fitted, the effect size expressed in units of residual standard deviation, and the significance level alpha. It is done before the experiment, so you can change the design while changing it still costs nothing.
How many runs do I need for a DoE?
It depends entirely on the smallest effect you need to detect. For a 7-term model at alpha 0.05, the power calculation gives 82% power at 13 runs for a 1.0 sigma effect, but you need roughly 35 runs to reach 80% power for a 0.5 sigma effect. Decide the effect size that matters scientifically first, then read off the run count.
Does a non-significant result mean the factor has no effect?
No. It means the design did not detect an effect. At 31% power, which is what 13 runs give for a half-sigma effect, a real effect goes undetected roughly two times in three. The honest write-up is "not detectable at this design and range", together with the effect size the study was actually powered for.
How does factor range affect statistical power?
For an approximately linear effect, the observed effect scales with the range you span. Halving the range halves the standardised effect size, which for a 13-run 7-term design drops power from 82% to 31%. Widening ranges is usually the cheapest way to raise power, cheaper than adding runs, and is bounded only by safety and chemistry.
Is post-hoc power analysis worth doing?
Not for interpreting your own non-significant result. Observed power computed from the observed effect size is a deterministic function of the p-value and adds no new information. Post-hoc analysis is worth doing for one purpose: extracting a measured residual sigma from the completed study so the next design can be powered on real noise instead of a guess.
Can power analysis tell me my design is a good design?
No, only that it is large enough for a stated effect. A design can be adequately powered and still alias two factors you care about, or be a poor fit for the response surface you eventually need. Check aliasing and design type separately before committing runs.
Related reading
Evaluation for this topic
We evaluate this for your lab.
- Design of Experiments, RSM, templates.