

You have a new impurity peak at 4.1 min and three candidate structures from the synthesis route. Nobody wants to order three reference standards to find out which one it is. The obvious question is whether a computer can tell you where each candidate should elute, and whether that answer is good enough to act on.
The short version: retention time prediction is useful for ordering peaks and narrowing candidate lists. It is not useful for setting integration windows or acceptance criteria. This article shows exactly where that line sits, using real outputs from CovaSyn's retention time prediction.
What retention time prediction actually does
Reversed-phase retention on a C18 column is dominated by hydrophobicity. The linear solvent strength (LSS) model expresses this as log k = log k_w − S * phi, where k is the retention factor, phi is the organic fraction, k_w is the extrapolated retention in pure water and S is a slope that scales roughly with molecular size.
A prediction estimates k_w and S from the structure, then converts the resulting k back to a retention time using the column dead time t0. That is the whole mechanism. Everything else is a way of estimating k_w and S better than a plain logP correlation does.
This matters because it tells you immediately what the prediction can and cannot know. It knows hydrophobicity. It does not know your specific batch of silica, your dwell volume, your buffer's effect on a partially ionised analyte, or whether the peak is a secondary interaction with residual silanols.
Three jobs it is genuinely good for
Peak tracking across method changes.
When you change the gradient or move from a 4.6 mm to a 2.1 mm column, peaks move and can swap order. A prediction gives you a prior expectation of the order, so you can check whether your tracking assumption survives.
Impurity assignment triage.
You have a peak and five plausible structures from the route or from forced degradation. Prediction rarely names the compound, but it routinely eliminates candidates that should elute in a completely different region. That saves reference standard purchases.
First-pass method scoping.
Before you touch an instrument, an estimated elution spread tells you whether a 15 min gradient is roughly right or whether half your analytes will stack in the void.
Notice that all three are ordering problems, not measurement problems.
Worked example: a paracetamol related-substances panel
We predicted retention times for a paracetamol impurity panel plus reference analytes and set calculated logP values beside them. Every number below is taken unchanged from our calculation on 2026-07-15.
All analytes share the same assumed method context: generic C18 column (150 × 4.6 mm), mobile phase ACN/H2O, flow 1.0 mL/min.
| Analyte | Role | calculated logP | Predicted RT (min) | Confidence |
|---|---|---|---|---|
| Caffeine | reference, polar | −1.03 | 2.0 | 0.8 |
| 4-Aminophenol | Ph. Eur. impurity K | 0.97 | 3.2 | 0.8 |
| Paracetamol | API | 1.35 | 3.2 | 0.8 |
| 4-Acetamidophenyl acetate | process impurity | not measured | 3.2 | 0.8 |
| Hydroquinone | degradant | not measured | 3.3 | 0.8 |
| 4-Nitrophenol | Ph. Eur. impurity F | not measured | 3.3 | 0.8 |
| Benzoic acid | reference, acidic | not measured | 3.5 | 0.8 |
| 4-Chloroacetanilide | Ph. Eur. impurity J | 2.30 | 4.2 | 0.8 |
| Ibuprofen | reference, lipophilic | not measured | 5.0 | 0.8 |
| Stearic acid | reference, very lipophilic | not measured | 16.5 | 0.8 |
As a matching starting method for paracetamol, our analysis returned: water + 0.1% TFA / acetonitrile, gradient 10% B at 0 min, 20% B at 2 min, 60% B at 12 min, hold to 15 min, 1.0 mL/min.
Read this table the way a practitioner should
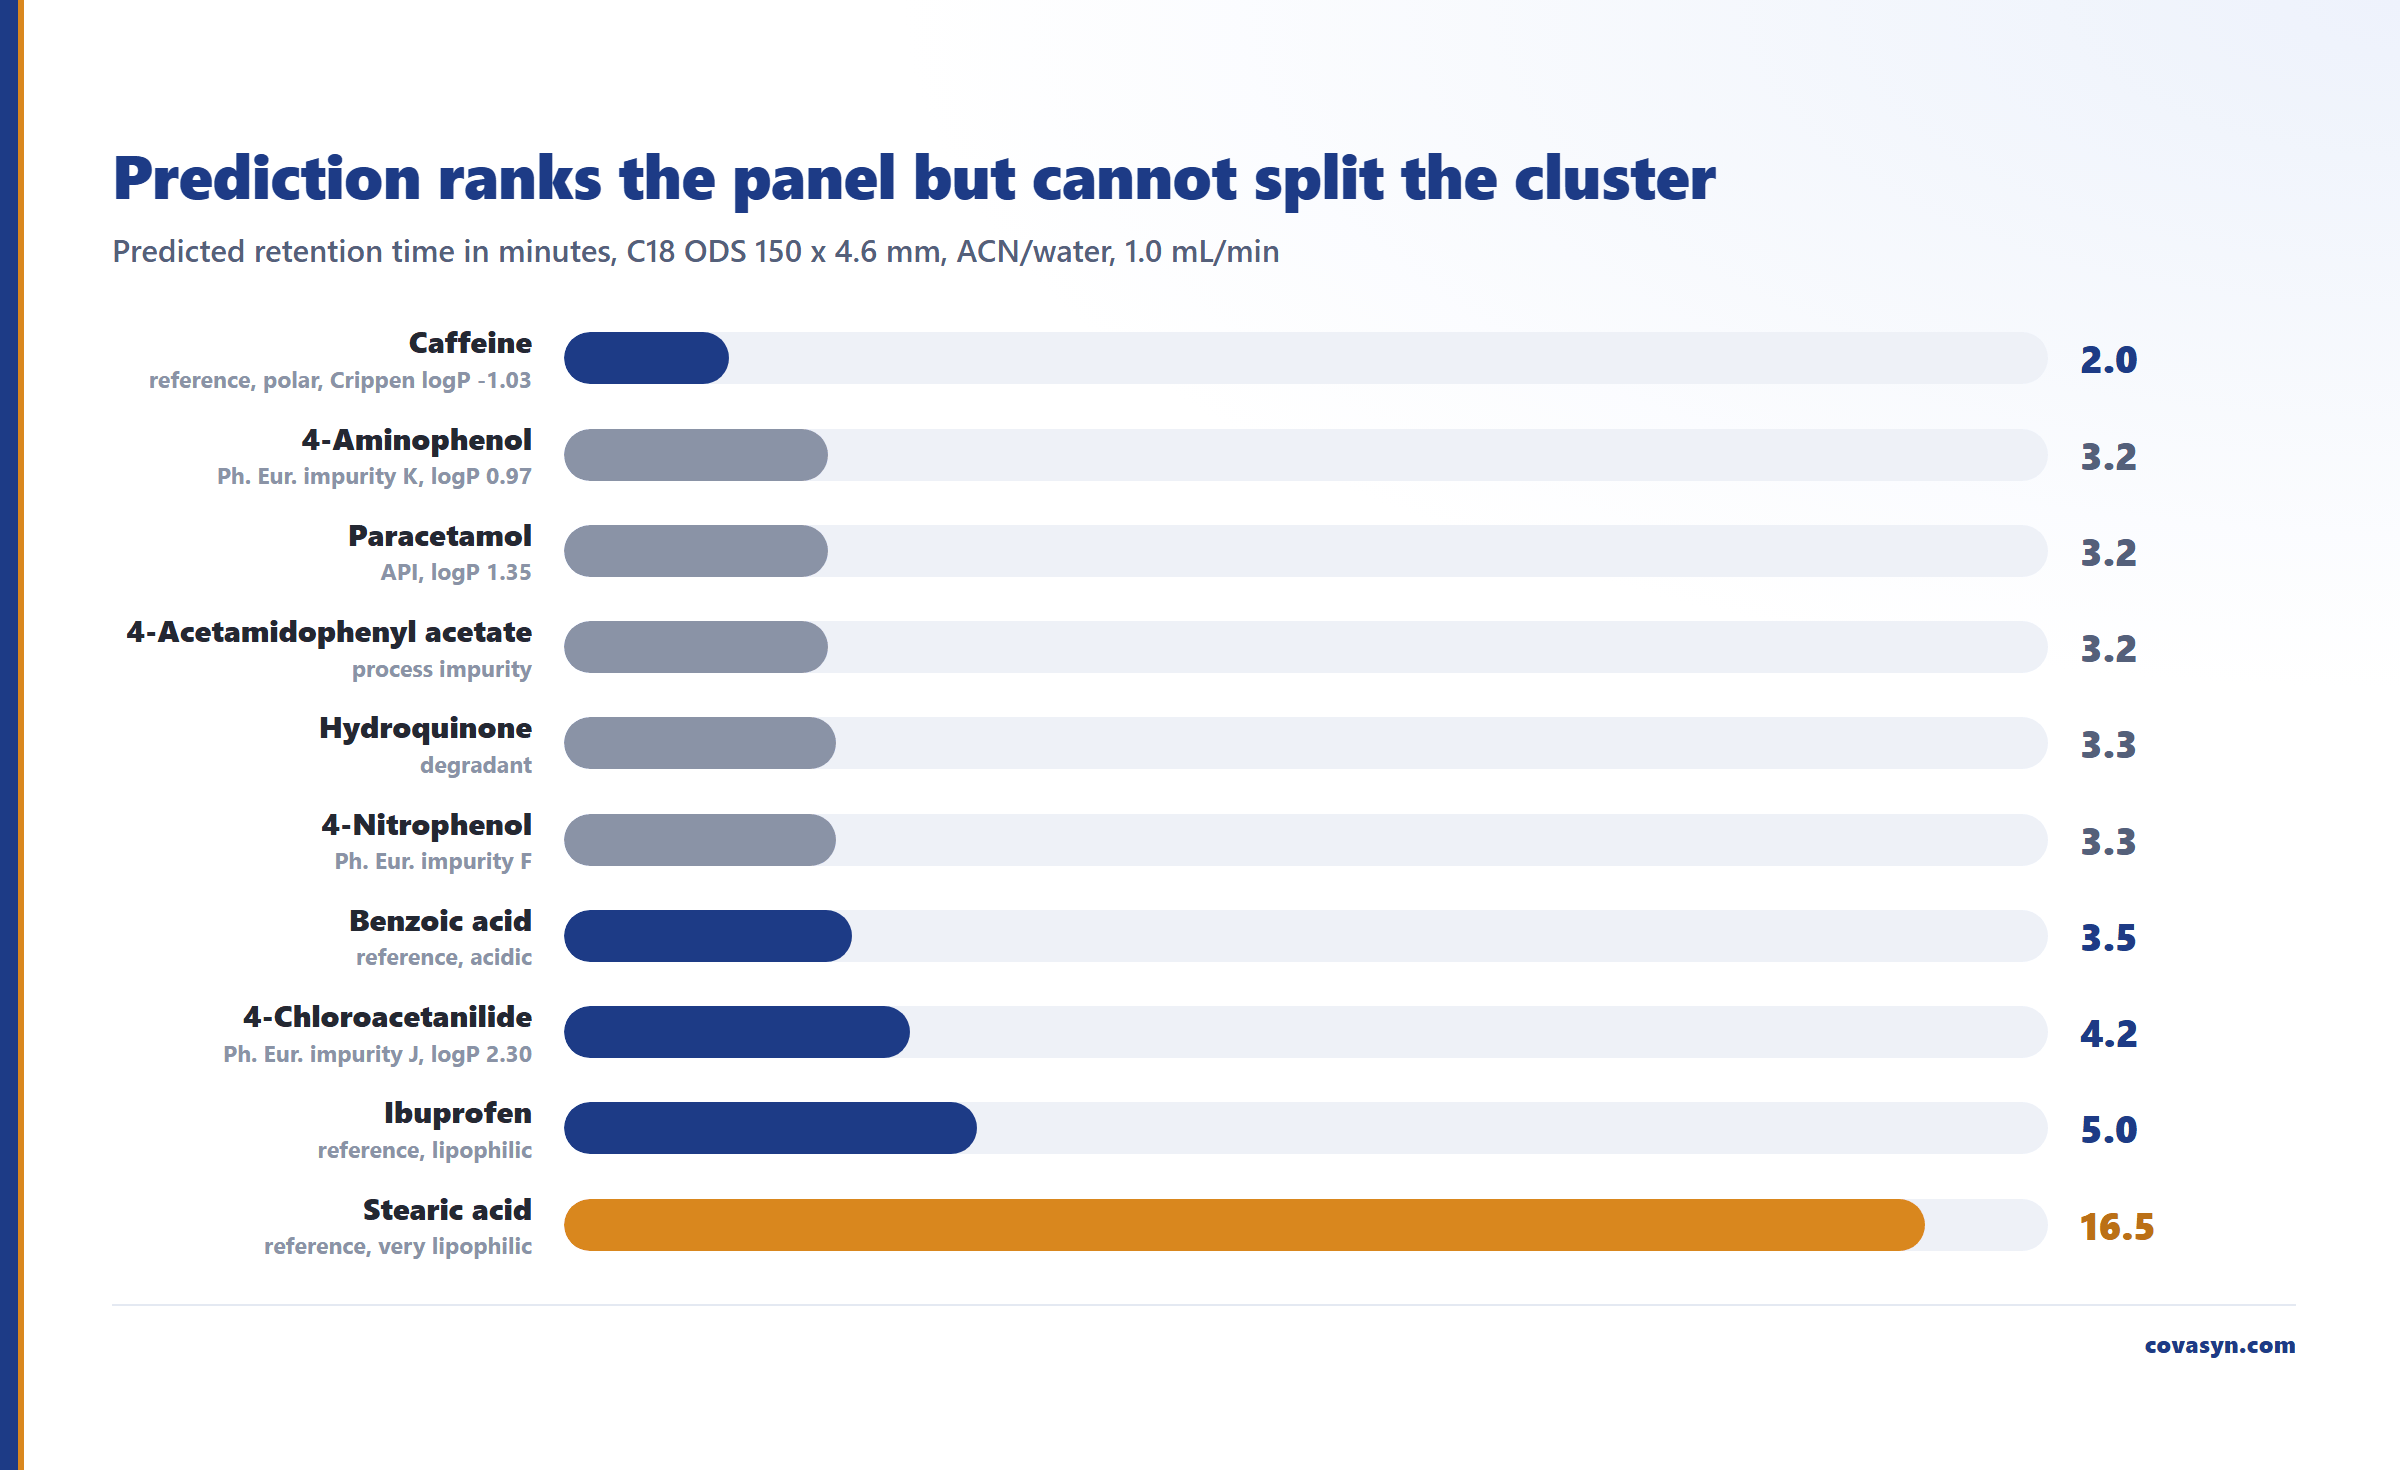
The useful signal is the ordering across the wide logP range. Caffeine (logP −1.03) at 2.0 min, the acetanilide cluster around 3.2 to 4.2 min, ibuprofen at 5.0 min, stearic acid at 16.5 min. That ranking is correct and it is what you use for scoping and for eliminating candidates.
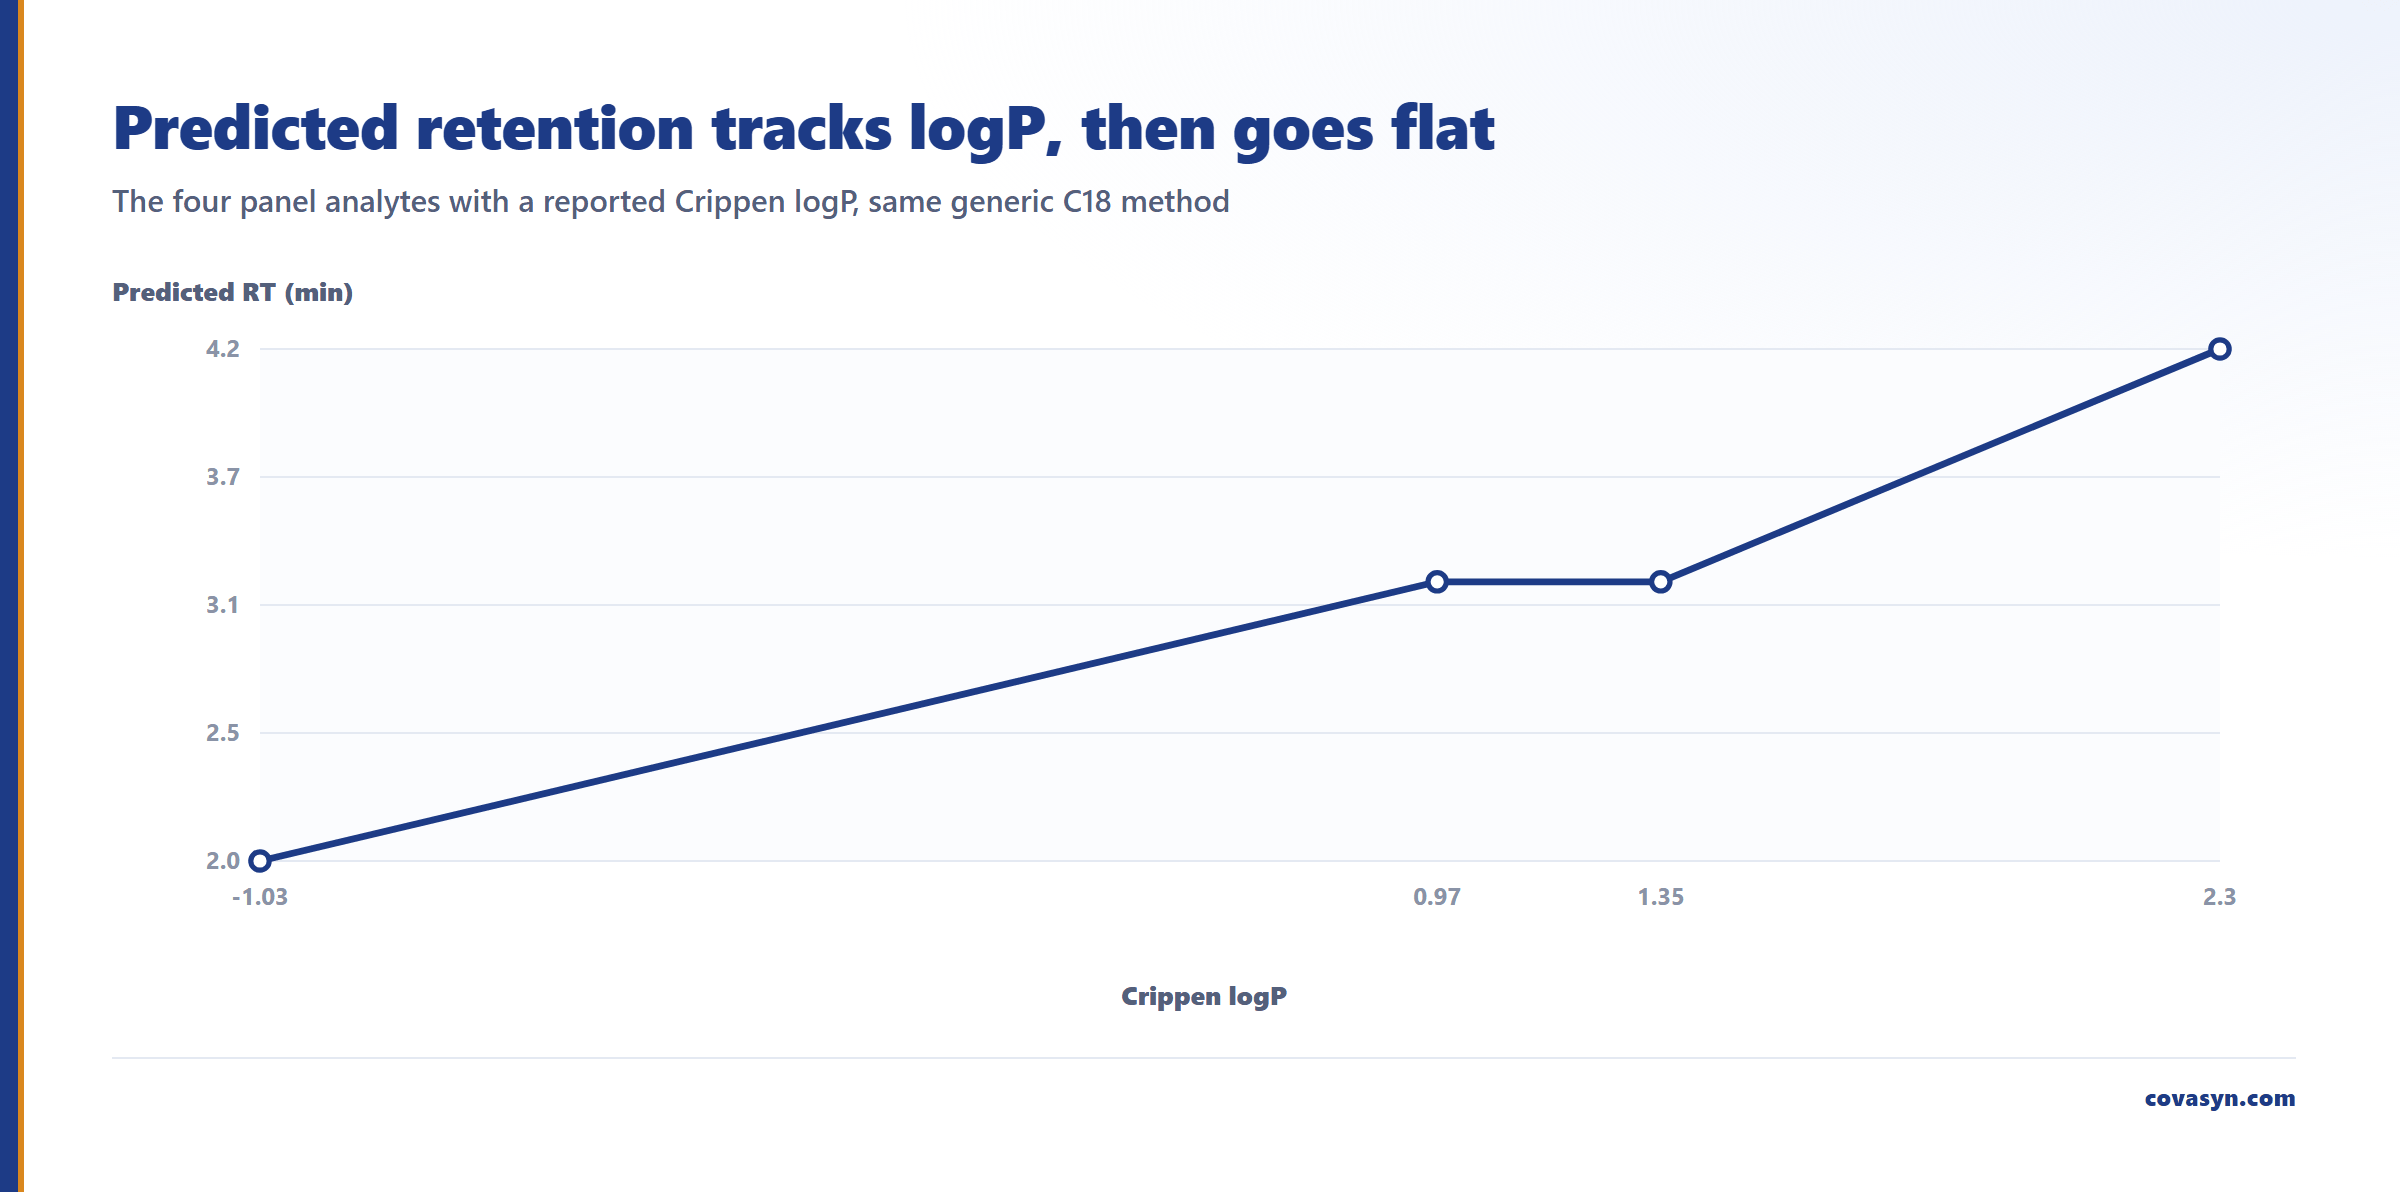
The unusable part is the resolution inside the cluster. Paracetamol and 4-aminophenol both come back at 3.2 min. On a real Ph. Eur. related-substances gradient, 4-aminophenol elutes clearly before paracetamol, because it is substantially more polar and, at low pH, partly protonated. The model compressed a difference that a real method separates easily. Five analytes returning 3.2 to 3.3 min is a statement that the model cannot rank them, not a statement that they co-elute.
What the constant confidence of 0.8 means
Every prediction returned the same confidence of 0.8. That is not a coincidence and it is not a validated accuracy figure. A value that is identical across the whole panel shows that no compound-specific evidence was available for any of these analytes.
In plain terms: you are looking at a general hydrophobicity estimate on the LSS principle, not a prediction from data on these specific compounds. Treat a flat confidence across a panel as a flag that the model had no compound-specific evidence, not as a quality score.
Honest limits: what this does not tell you
- It is not a calibrated retention time. The returned RT is an isocratic-equivalent estimate at fixed generic default conditions, converted with a fixed dead time. The proposed gradient is a separate recommendation. Do not expect the reported minute value to appear on your chromatogram.
- It does not resolve close pairs. Anything inside roughly plus or minus 1 min in the current output should be treated as one unranked bin.
- Ionisation is only crudely handled. For acids and bases near the mobile phase pH, the real retention depends strongly on buffer pH and ionic strength. A structure-only prediction will get these wrong most often.
- No column-specific transfer. The prediction assumes a generic C18 column (150 × 4.6 mm) and does not model your specific stationary phase chemistry, endcapping or silanol activity.
- It cannot identify anything. A retention match is consistent with an assignment. It is never proof of one. Confirmation needs MS, NMR or a reference standard.
- This is decision support, not a validated method. Nothing here substitutes for ICH Q2(R2) method validation or belongs in a regulatory filing as evidence of identity.
How to use it without getting burned
1. Anchor with standards you already have. Run two or three compounds spanning your logP range on your actual method, then fit predicted versus observed. Use the fit, not the raw prediction. 2. Work in relative retention. RRT against the API is far more transferable between systems than absolute RT, and it is what pharmacopoeial monographs use anyway. 3. Use predictions to rank, then confirm the top candidate. One reference standard bought instead of five is the actual return on investment. 4. Treat a flat confidence value as "no compound-specific data". Widen your window accordingly. 5. Never set an integration window from a prediction. Set it from injected material.
For context on what is achievable at the state of the art: the largest public retention dataset, METLIN SMRT, contains around 80,000 small molecules, all measured on a single reversed-phase system. Models trained on it perform well on that system and degrade when transferred to a different column and gradient. Transfer between chromatographic systems, not raw model capacity, is the binding constraint in this field. Any method that claims system-independent minute-level accuracy is overselling.
A prediction is also only as useful as the column it assumes. If the phase chemistry does not suit the molecule, no retention model rescues the method, so settle that first with the HPLC column selection chart and decision tree.
Frequently asked questions
How accurate is retention time prediction in HPLC?
Accuracy depends entirely on whether the model was calibrated on your chromatographic system. Structure-only predictions like CovaSyn's reliably rank analytes across a wide hydrophobicity range but compress close pairs: in our paracetamol panel, paracetamol and 4-aminophenol both returned 3.2 min despite separating cleanly in practice. Use predictions for elution order, then calibrate against two or three real standards on your own method.
Can you predict retention time from a SMILES string?
Yes, and that is the normal input. The structure yields a predicted retention time, a confidence value and the assumed column and mobile phase. Because only the structure is supplied, the result is a generic C18 estimate, not a prediction for your specific instrument and column.
What is retention time prediction actually used for in pharma?
Three things: peak tracking when a method changes, triaging candidate structures for an unassigned impurity peak, and first-pass scoping of gradient length before instrument time is booked. All three are ordering tasks. It is not used to set integration windows, system suitability criteria or identity acceptance limits, because those require measured data from validated methods.
Why do several compounds get the same predicted retention time?
Because the model cannot distinguish them from structure alone. When predictions cluster within about a minute, treat that cluster as a single unranked bin rather than as a co-elution prediction. A constant confidence value across a panel (0.8 in our run) signals that no compound-specific data was available.
Does predicted retention time count as impurity identification?
No. A retention match is consistent with an assignment but never establishes one. Identification requires orthogonal confirmation: mass spectrometry, NMR, or co-injection with a qualified reference standard. Prediction reduces how many standards you need to buy by eliminating candidates that should elute in a different region of the chromatogram.
How do I make a prediction transferable to my method?
Convert to relative retention. Run two or three anchor compounds spanning your lipophilicity range on your actual gradient, fit predicted against observed retention, and express everything as RRT versus the API. Pharmacopoeial monographs already use RRT for exactly this reason: it survives changes in dwell volume, column dimensions and flow rate far better than absolute minutes.
Related reading
Evaluation for this topic
We evaluate this for your lab.
- HPLC method development: column, gradient, retention time.
- Foundations: molweight, LogP, pKa, SMILES.