

You stressed the API, ran the gradient, integrated everything above the reporting threshold, and the assay plus total degradants came to 91%. Nine percent of the drug substance is unaccounted for. Reviewers will ask where it went, and "the method is stability-indicating" is not an answer until you can say what happened to the missing mass.
This is the normal case, not a failure of technique. Mass balance in forced degradation fails for a small number of specific, diagnosable reasons. This article walks each one and shows, with a worked example, how to close the gap.
What mass balance actually means
Mass balance is the sum of the assay value and the total measured degradants, expressed against the initial content of the unstressed control. It is a consistency check on the analytical picture, not a measurement of anything physical.
ICH Q1A(R2) asks that stress studies support the stability-indicating power of the method. Its glossary defines mass balance as the sum of assay and degradation products compared with the initial value, with due consideration of the analytical uncertainty. It sets no numeric value. Most companies apply an internal window, commonly 95% to 105%, and treat anything outside it as an investigation trigger rather than a rejection.
Such a window is a fixed arithmetic rule with no uncertainty propagation: it does not know your assay precision. A total of 95.1% is therefore not a clearance, and 94.9% is no proof of a problem, as long as you do not know the scatter of your method.
A worked example: acid stress on an ester API
Take aspirin (acetylsalicylic acid) under 0.1 M HCl. This is a useful teaching case because the dominant degradation route produces one degradant you will see easily and one you will not see at all.
First, what to expect. CovaSyn's degradation prediction returned four candidate products for acetylsalicylic acid. Two matter:
| Product | Formula | Exact mass (Da) | Pathway |
|---|---|---|---|
| Salicylic acid | C7H6O3 | 138.03169 | Ester hydrolysis |
| Acetic acid | C2H4O2 | 60.02113 | Ester hydrolysis |
There is a typical trap in one table. Ester hydrolysis splits the molecule into two fragments. Salicylic acid carries the chromophore and appears in the chromatogram; acetic acid is practically invisible at your wavelength. For mass balance this is not a problem as long as salicylic acid is accounted for in drug-equivalents, i.e. against a standard or with a response factor and converted molar to the parent. It only becomes a gap when uncorrected area percentages are added up.
Now the arithmetic. Assume a stressed sample with 79.6% assay remaining and three integrated degradant peaks at 5.9%, 4.3% and 1.2% area. The degradants sum to 11.4%, the mass balance to 91.0%. It sits below the usual window.
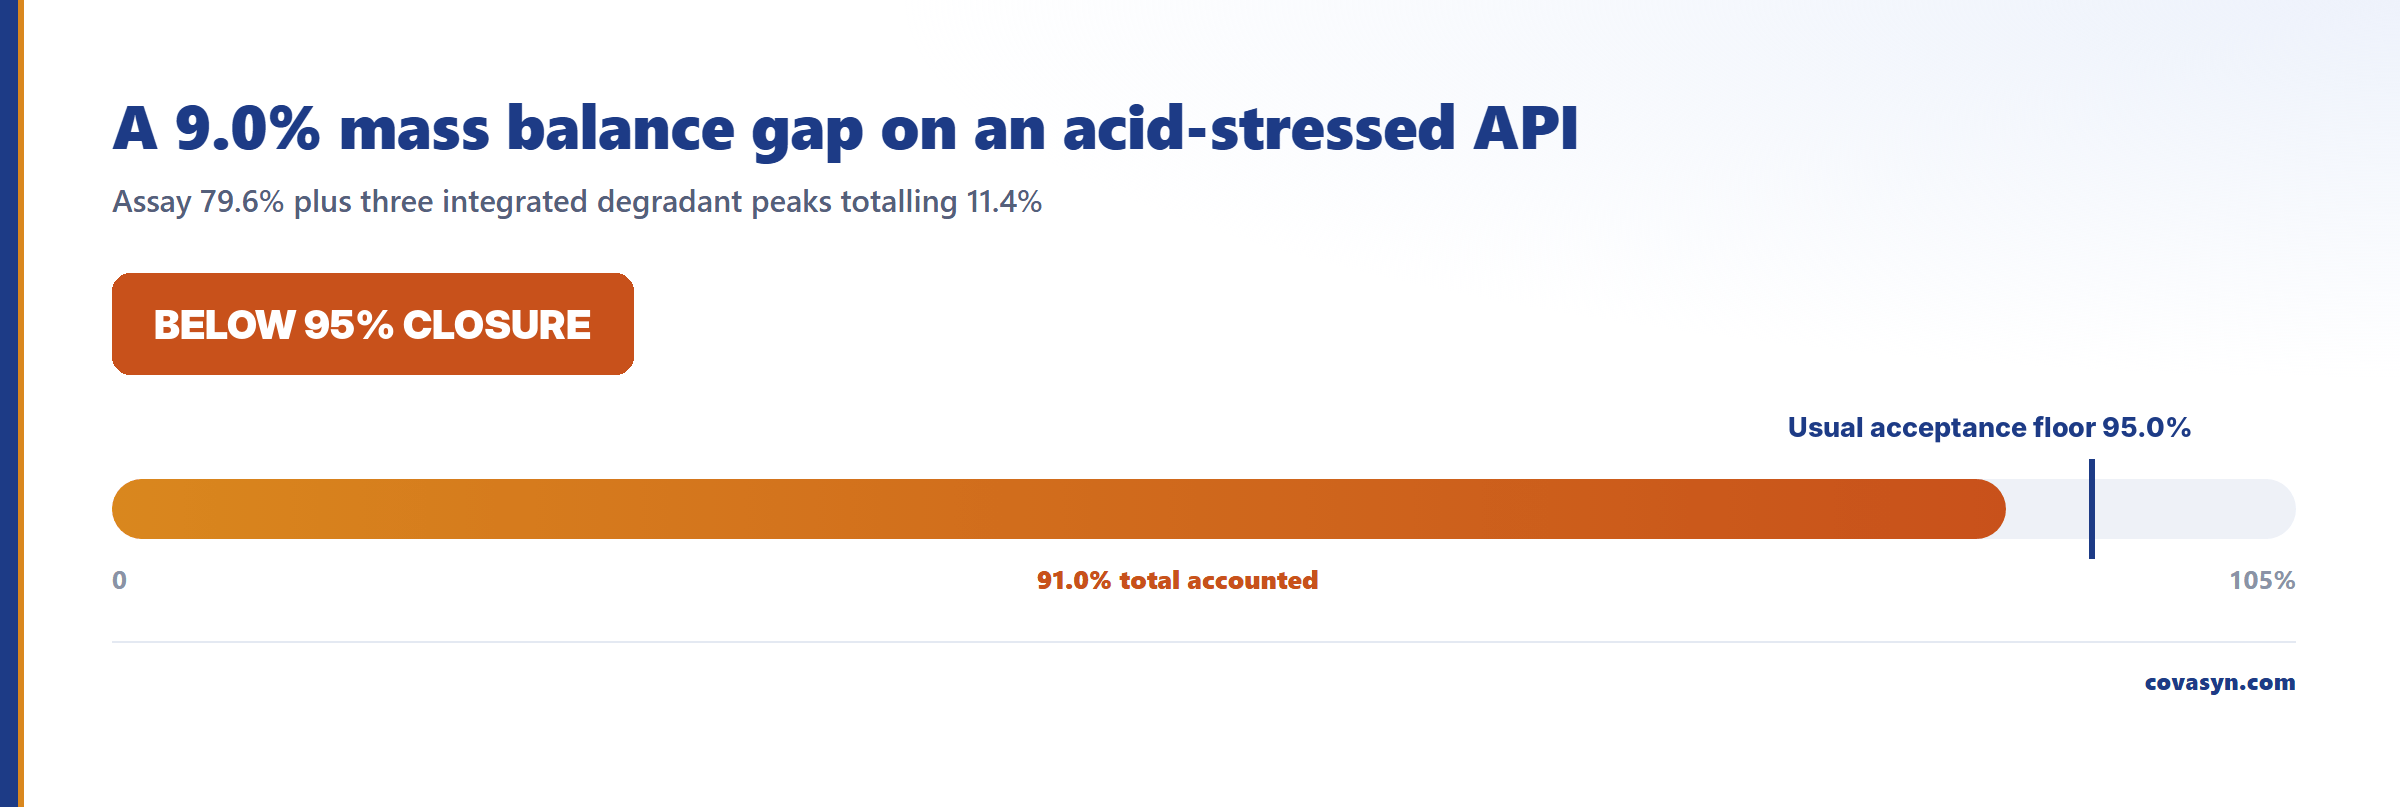
A 9.0% gap remains. Note that the assay and peak-area figures here are a constructed but realistic scenario: the derived totals are calculated, the inputs are illustrative.
The four causes of a mass balance gap
Work them in this order. The first two explain most gaps.
1. Response factor mismatch
The default sin is area normalisation: reporting each degradant as its percentage of total peak area, as though every compound absorbs like the parent. It does not. A degradant that has lost conjugation, gained a hydroxyl, or opened a ring can have a relative response factor well under or over 1.0 at your monitoring wavelength.
Fix: quantify against an authentic standard where you have one, and determine the RRF experimentally. Where you do not have a standard, a diode-array purity spectrum plus a charged aerosol or CAD/ELSD channel will tell you quickly whether the UV response is misleading you.
In our worked case, re-quantifying the main degradant against a salicylic acid standard instead of by area normalisation, and integrating a fourth small peak that had sat under the reporting threshold, raises the degradants to 17.6%. The mass balance is then 97.2%, inside the usual window.
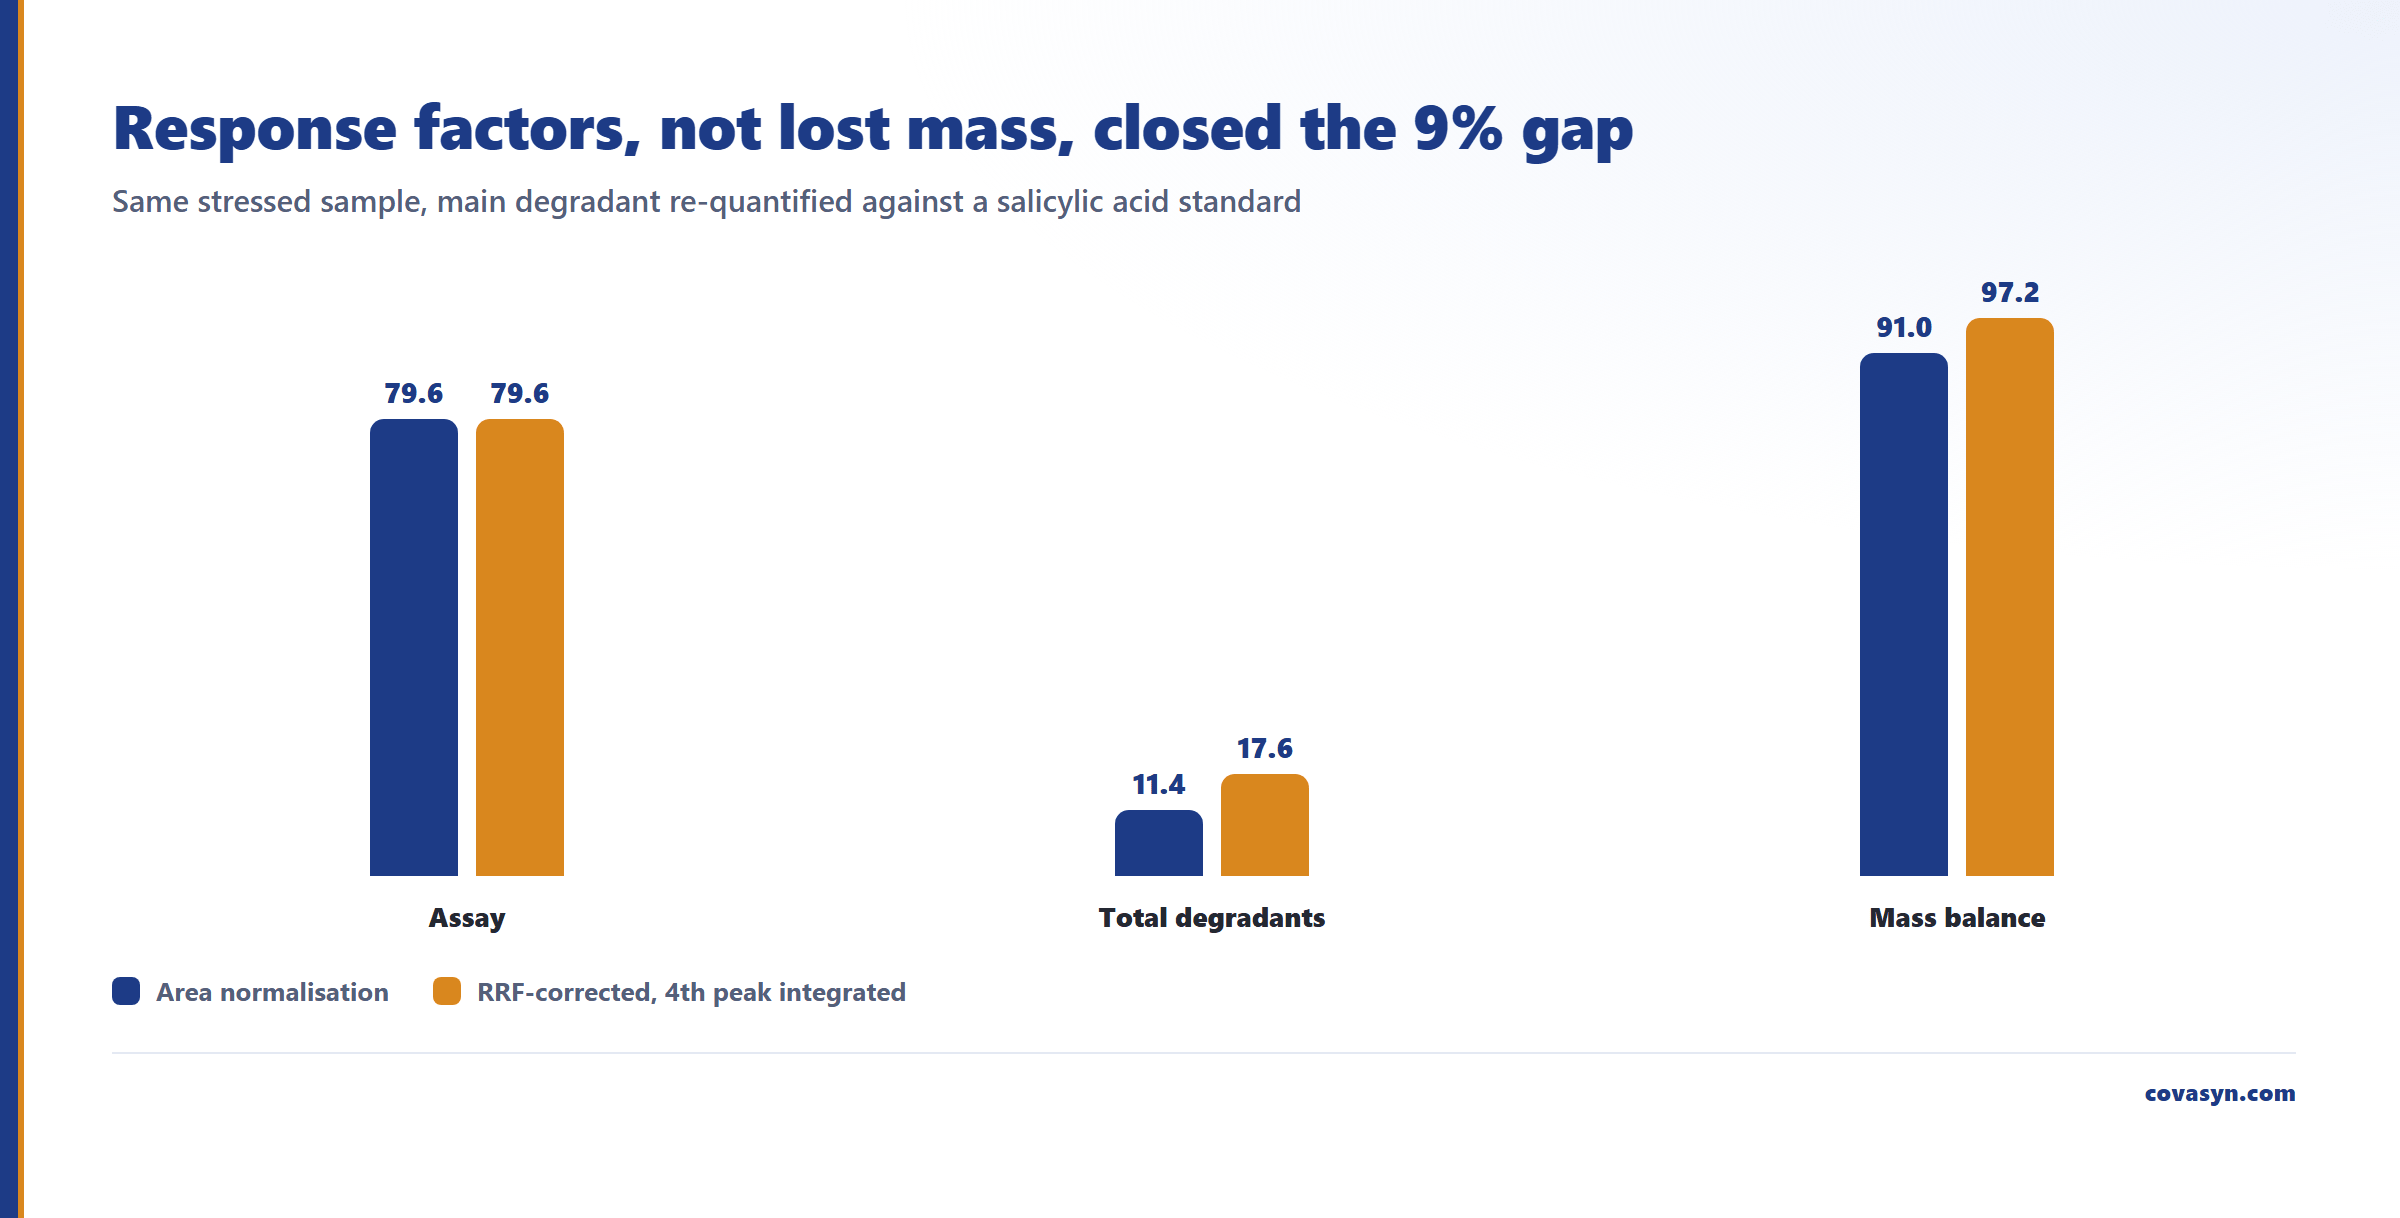
The RRF correction factor itself must come from your own standard: no calculation can replace it.
2. Degradants you cannot see
Three sub-cases, all common:
- No chromophore. Acetic acid, formaldehyde, formic acid, methanol, small aliphatic fragments. Invisible at 210 to 280 nm. Confirm with CAD, ELSD, RI, headspace GC or ion chromatography.
- Volatile. Anything that leaves during sample prep, evaporation or a hot autosampler. Acetic acid again, plus CO2 from decarboxylation.
- Not eluting. Highly polar fragments in the void, or a strongly retained polymer or dimer still on the column at the end of the gradient. Extend the gradient by ten minutes and look. This one is embarrassingly frequent.
3. Adsorption and precipitation
The degradant is formed, then removed from solution before it reaches the detector. Poorly soluble oxidation products crash out; basic or zwitterionic species adsorb to glass, filter membranes and PEEK. Test by comparing filtered and centrifuged aliquots, and by re-running a sample after a solvent-strength change.
4. Over-stressing
Push past roughly 20% degradation and you start generating secondary and tertiary products from the primary degradants. Each generation is smaller, more numerous and less detectable. Mass balance degrades with degradation extent. ICH does not require a target, but 5 to 20% loss is the practical window in which a gap is still interpretable.
Using structural prediction to name the missing mass
Once you have a gap, the useful question is which pathway it belongs to. The approach is to match an observed peak list against the predicted degradant set across all stress arms. We evaluated the five ICH Q1A/Q1B conditions on the same API, with the observed peaks available as protonated m/z:
| Condition | Peaks | Identified | Notes |
|---|---|---|---|
| Acid | 3 | 3 | salicylic acid, acetic acid, decarboxylation product |
| Base | 2 | 2 | salicylic acid, acetic acid |
| Oxidative | 1 | 0 | m/z 197.0444 unassigned |
| Thermal | 1 | 1 | salicylic acid |
| Photolytic | 2 | 1 | salicylic acid; 197.0444 unassigned |
Across all arms, six assignments fell to ester hydrolysis and one to decarboxylation.
Two things to read from this. First, hydrolysis dominates across four of five arms. The gap is therefore first a question of the salicylic acid response factor, not of the missing acetic acid. Second, the oxidative peak is unassigned. The prediction set did not contain an oxidation product, so that peak is real work: MS/MS, an authentic standard, or both.
A mass-matching trap worth knowing:
in positive electrospray you measure protonated ions, not neutral molecules. Matching neutral exact masses (138.0317 Da, 60.0211 Da) against observed m/z values finds nothing; only the [M+H]+ values (139.039, 61.0284) fit. Add 1.00728 Da before you compare.
Honest limits
What this analysis does not do:
- Mass balance is arithmetic. A sum plus a fixed window. No uncertainty propagation, no assay-precision awareness, no distinction between a 4% gap on a well-behaved method and a 4% gap on a noisy one.
- The degradation prediction over-generates. The same aspirin prediction that correctly returned salicylic acid and acetic acid also returned water as a "dehydration" product and a decarboxylation product of questionable chemistry. Read the list as hypotheses to test, not as a degradation profile.
- A mass match is not an identification. Every hit in the table above rests on mass agreement alone. Structural confirmation needs MS/MS, retention-time agreement with an authentic standard, and ideally NMR.
- No regulatory classification without peak areas. Whether a peak reaches the ICH Q3A/Q3B reporting, identification or qualification threshold can only be said from area or content values, not from mass alone.
- None of this replaces the wet-lab work. It narrows what you go and measure. Your filing rests on the measurement.
Frequently asked questions
What is an acceptable mass balance in forced degradation?
ICH Q1A(R2) defines mass balance in its glossary with due consideration of the analytical uncertainty and sets no numeric limit. Most organisations apply an internal window of 95% to 105% as an investigation trigger. A gap outside the window requires a documented rationale, not automatic rejection of the study.
Why does mass balance fail in forced degradation studies?
Four causes account for nearly all gaps. First, relative response factors: area normalisation assumes every degradant absorbs like the parent, which is rarely true. Second, degradants that are non-chromophoric, volatile, or that do not elute within the gradient. Third, adsorption or precipitation removing material before detection. Fourth, over-stressing beyond about 20% degradation, which generates secondary products too small and numerous to track.
How do I account for non-chromophoric degradants?
Use a detector that does not depend on a chromophore. Charged aerosol detection (CAD), evaporative light scattering (ELSD) and refractive index respond to mass rather than absorbance. For small volatile acids and alcohols, headspace GC or ion chromatography is more appropriate than any LC-UV method. Structural prediction helps you know what to look for: it flagged acetic acid (C2H4O2, 60.02113 Da) as an ester-hydrolysis product of aspirin before any experiment was run.
Do I need a relative response factor for every degradation product?
Not for every peak, but for anything at or above the ICH Q3A/Q3B identification threshold that materially affects the mass balance. Determine RRF against an authentic standard at the monitoring wavelength. Where no standard exists, an orthogonal mass-sensitive detector gives you a defensible estimate of whether the UV response is over- or under-reporting that peak.
How much degradation should a forced degradation study target?
Roughly 5% to 20% loss of the API. Below 5% the degradants are too close to the noise to characterise. Above 20% you begin generating secondary degradation products from primary degradants, and mass balance becomes progressively harder to close and harder to interpret. ICH Q1A(R2) sets no target; this range is common practice.
Can software identify my unknown degradation peaks?
It can rank hypotheses, which is usually the bottleneck. In the example above, observed protonated masses were matched against a predicted degradant set across five stress arms and assigned to pathways. But every match rested on mass alone. That narrows your MS/MS and standards work; it does not close it.
Related reading
Evaluation for this topic
We evaluate this for your lab.
- Mass spectra, formula prediction, impurity profiling.