

Most forced degradation studies fail not because the chemistry is hard, but because the design is decided one condition at a time. You over-stress the acid arm to a charred mess, under-stress the oxidative arm, and end up three months later with a stability-indicating method that has never seen the degradant that actually matters. This is a practical design guide: how to pick stressors, how far to push each one, how to read mass balance honestly, and what a kinetics fit tells you before you commit method development time.
What ICH Q1A(R2) actually requires
Q1A(R2) is thinner than most people remember. Stress testing on a single batch of drug substance is expected to cover the effect of temperature (in 10 °C increments above accelerated), humidity where appropriate, oxidation, hydrolysis across a range of pH, and photolysis (the latter detailed in Q1B). The guideline says results should identify likely degradation products and help establish the degradation pathways and the intrinsic stability of the molecule, and that it should validate the stability-indicating power of the analytical procedures.
What Q1A(R2) does not do is give you numbers. No target degradation percentage, no stressor concentrations, no time points. Those come from practice, and getting them wrong is the usual failure mode.
Target degradation: aim for 5 to 20 percent
The working convention across industry is 5 to 20 percent degradation of the API per stress condition, with 10 percent as a common midpoint. The reasoning is mechanical:
- Below roughly 5 percent, degradant peaks sit near the limit of quantitation. Peak purity and mass balance become noise-dominated, and you cannot demonstrate separation you cannot see.
- Above roughly 20 percent, secondary degradation kicks in. You start characterising degradants of degradants, which will never appear on real stability at 25 °C / 60 percent RH, and you waste identification effort on artefacts.
The right way to hit that window is a short kinetics screen, not a single 14-day endpoint. Run three or four time points per condition, fit the loss, then choose your definitive stress time from the fitted rate.
Worked example: three hydrolytic and oxidative arms
Below is a real analysis with CovaSyn's stability analysis on a representative small-molecule stress dataset (assay expressed as percent label claim, five time points per arm over 14 days). The inputs are a representative dataset; every result value is genuinely computed and quoted unchanged.
| Condition | Loss at 14 d | Fitted rate | Kinetic order | R2 | n points |
|---|---|---|---|---|---|
| Oxidative | 27.7% | 1.9699%/day | zero order | 0.9982 | 5 |
| Acid | 20.9% | 1.4871%/day | zero order | 0.9992 | 5 |
| Base | 13.6% | 0.9795%/day | zero order | 0.9994 | 5 |
Three things fall out of this immediately.
The oxidative arm is over-stressed.
At 27.7 percent loss it is outside the 5 to 20 percent window. The fitted rate of 1.9699%/day tells you what to do: pull the definitive oxidative arm at about 5 days for ~10 percent, or dilute the peroxide. You do not need another 14-day experiment to learn that.
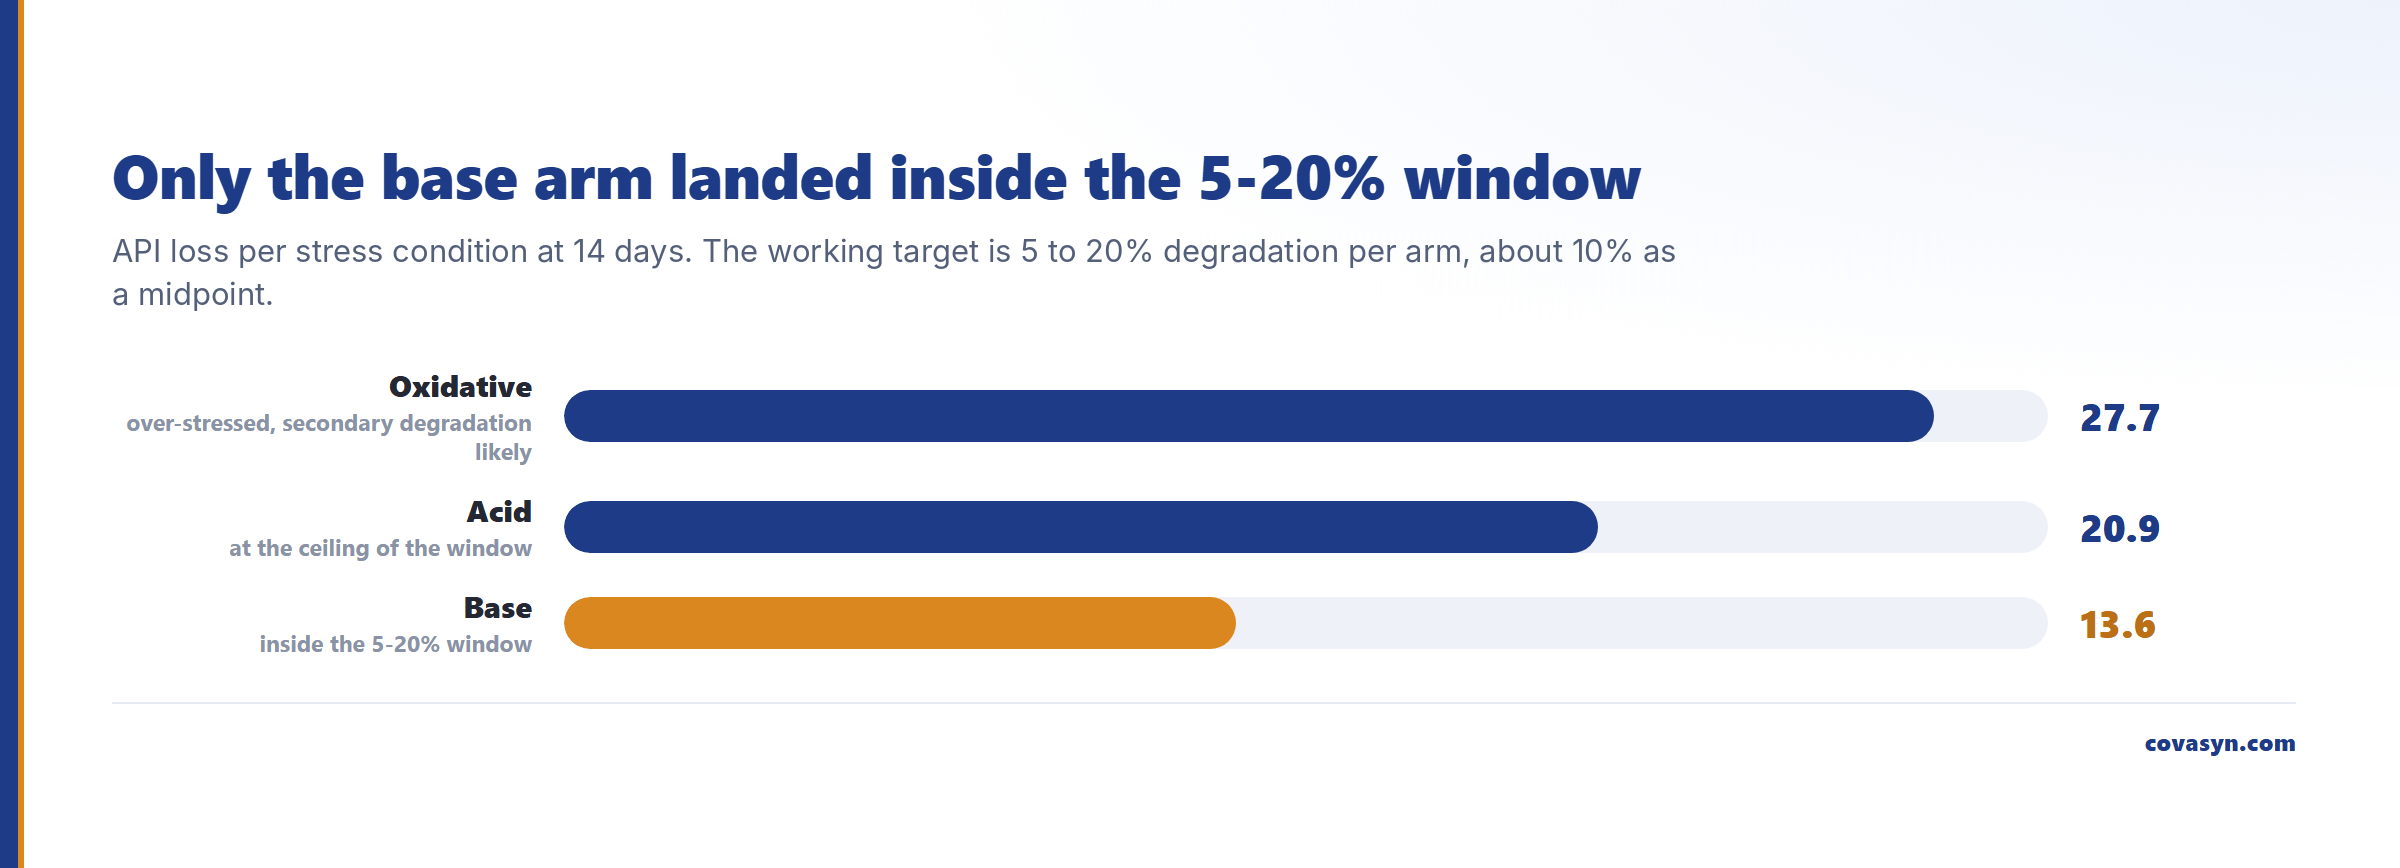
Base is the mildest pathway, acid is intermediate.
The rate ordering 1.9699 > 1.4871 > 0.9795%/day is the pathway ranking. It says where the control strategy and the specification should focus, and which degradant the stability-indicating method must resolve first.
All three fit zero order with R2 of 0.9982 to 0.9994.
Over this window the loss is effectively linear, which is what makes time-point extrapolation defensible. If a condition had come back first or second order with a poor fit, linear extrapolation to a target time would be the wrong tool.
One honest flag: the kinetics sees assay only. Mass balance is a separate calculation.
Mass balance: what the number means and what it hides
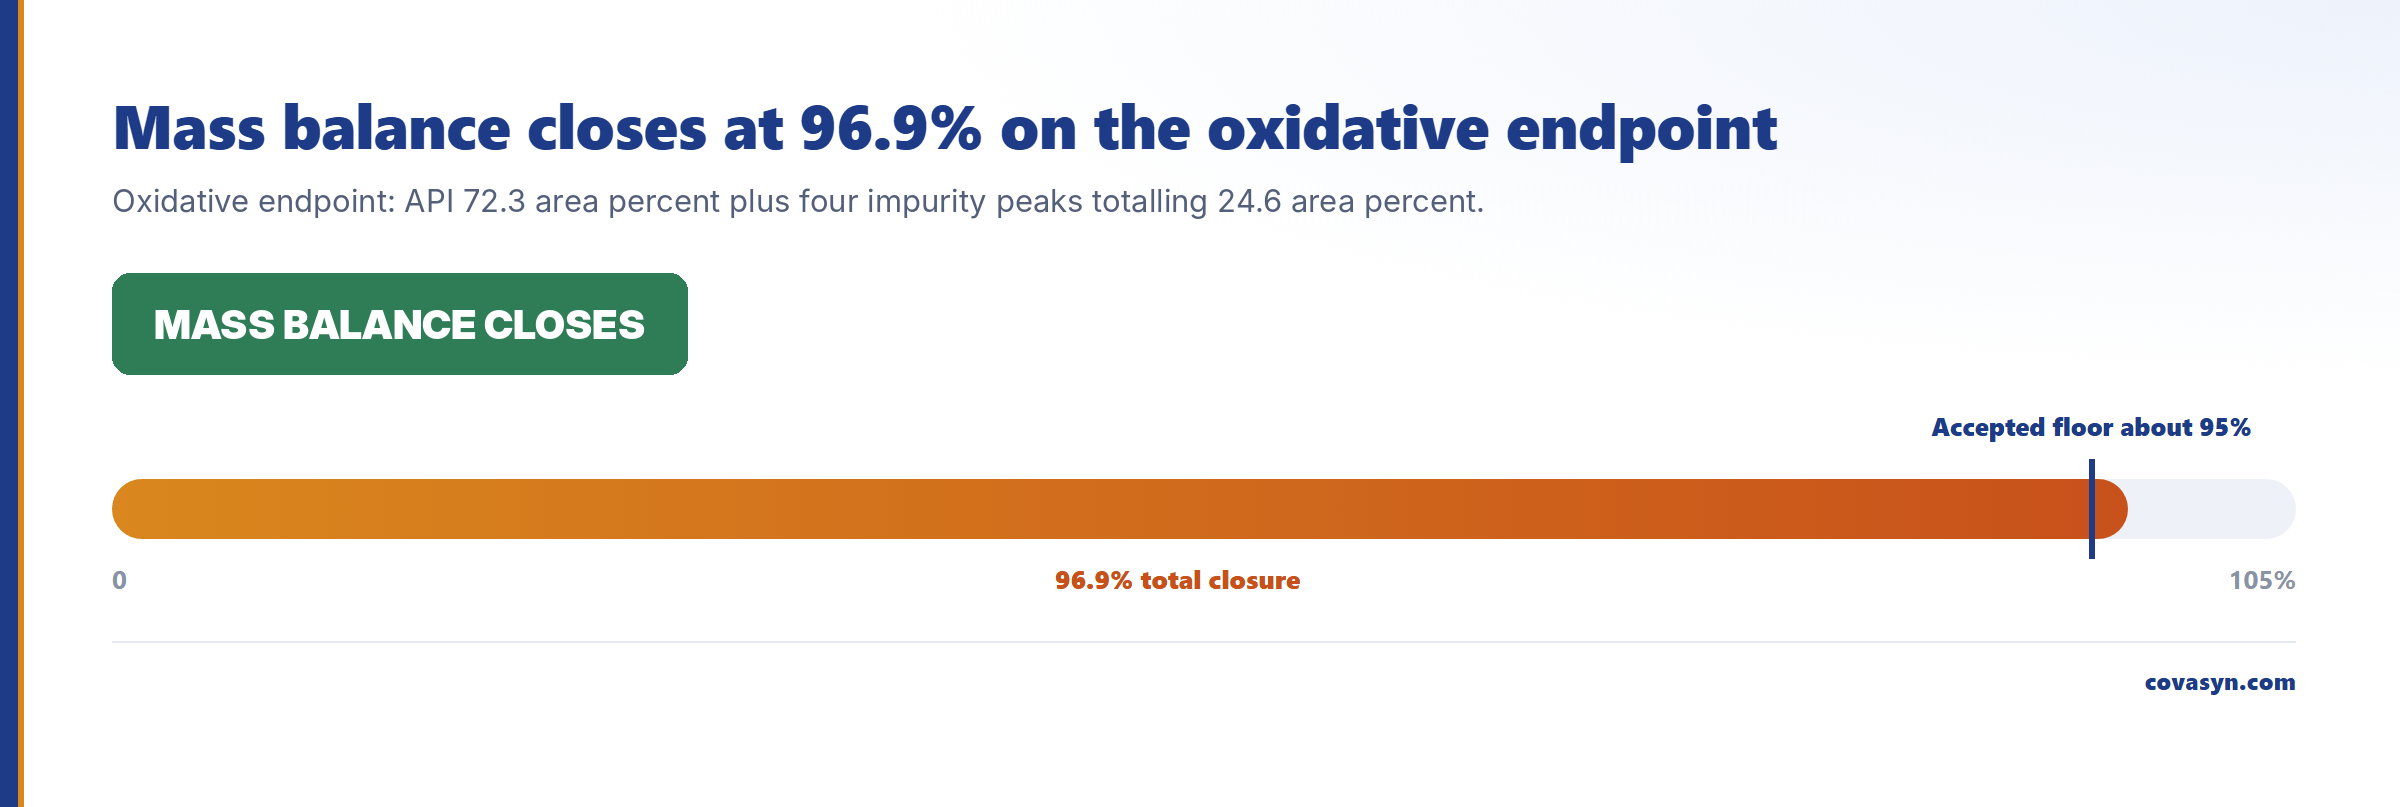
Mass balance is the sanity check that your degradant peaks account for the API you lost. For the oxidative endpoint (assay against reference standard 72.3%, four degradation peaks at 11.4, 6.9, 4.1 and 2.2% relative to the initial content) it gives:
- Total balance: 96.9%
- API: 72.3%
- Impurities: 24.6%
- Assessment: pass
96.9 percent closure is acceptable for a peak-area calculation. The caveat matters more than the number: this is uncorrected area percent. It assumes every degradant has the same detector response factor as the parent, which is rarely true at a fixed UV wavelength, and a degradant that loses the chromophore can be invisible. Treat a passing mass balance as evidence that you have probably not missed a large degradant, not as proof that you have found them all. Below about 95 percent closure, the usual suspects are a non-chromophoric degradant, a volatile loss, or something retained on column.
Predicting which degradants to look for
Before the LC-MS run, it is worth knowing what to expect. For omeprazole, an acid-labile sulfoxide, the degradation prediction gave one product under oxidation:
- SMILES
COc1ccc2nc(S(=O)(=O)Cc3ncc(C)c(OC)c3C)[nH]c2c1 - pathway: oxidation at sulfur
- formula C17H19N3O4S, exact mass 361.10963, mass change +15.99491
That is the sulfone. The +15.995 mass shift is the single most useful thing to carry into the MS acquisition: it turns an untargeted search into a targeted one.
Matching the stress-condition peak lists against that prediction closes the loop. With a small synthetic peak list across the three arms, the result was:
- oxidative: 2 peaks, 1 assigned as the sulfone with confidence 0.5; the second at m/z 346.122 is the protonated drug itself and does not belong in the degradation list
- acid: 2 peaks, 0 identified
- base: 1 peak, 0 identified
- 1 unique degradation product in total, via oxidation at sulfur
Be honest about what that means: one of five peaks was assigned, at 0.5 confidence. The rest are flagged unidentified rather than force-fitted. That is the correct behaviour for triage. It narrows where the analyst looks; it does not replace the reference standard, the accurate-mass confirmation or the NMR.
The lesson: remove the mass of the drug and its usual adducts from the peak list before matching. And for omeprazole the main degradation route is the acidic one; that nothing was assigned there is a gap in the prediction, not a finding about the sample.
Without integrated peak areas, the identified peak cannot be placed against the ICH reporting, identification and qualification thresholds. That needs real integrated areas.
Designing the stability-indicating method from the stress data
The stress study exists to prove the method is stability-indicating. Sequence it in this order:
1. Screen kinetics first. Three to five time points per condition, cheap assay. Get the rate, not just an endpoint. 2. Set definitive stress times from the fitted rate so each arm lands in 5 to 20 percent. From the table above, oxidative at ~5 d, acid at ~7 d, base at 14 d. 3. Include unstressed and blank controls for every condition. Peaks from the peroxide, the buffer or the vial are the most common false degradants. 4. Run the composite sample. Pool all stressed samples and confirm baseline resolution (Rs >= 1.5, or >= 2.0 if you want margin) between the API and every degradant. 5. Check peak purity on the API peak with PDA or MS, in every arm. Co-elution is what makes a method non-stability-indicating. 6. Close mass balance per arm and investigate any arm below ~95 percent before writing the method. 7. Photostability separately per ICH Q1B, with the dark control. Photolysis is a different exposure metric (lux hours and W h/m2), not a time-based stress.
What this does not tell you
- Zero-order kinetics over 14 days at forced conditions says nothing about the shelf-life mechanism. Forced degradation is a pathway map, not a predictive stability model. Shelf life comes from long-term data, evaluated under ICH Q1E by regression against the one-sided 95 percent confidence bound.
- The degradant prediction works from structure alone. It enumerates plausible pathway products. It does not rank likelihood by condition, and it will miss rearrangements and dimers.
- Identification confidence of 0.5 is a lead, not an assignment. Structure elucidation still needs accurate mass, MS/MS fragmentation and, for anything above the ICH qualification threshold, a synthesised standard.
- Area-percent mass balance ignores response factors. A closure of 96.9 percent is reassuring, not conclusive.
- These outputs are decision support and triage. They shorten method development; they do not substitute for validated wet-lab work or constitute a regulatory filing.
Frequently asked questions
How much degradation should a forced degradation study target?
The widely used target is 5 to 20 percent loss of the API per stress condition, with about 10 percent as a practical midpoint. Below 5 percent the degradant peaks are too close to the limit of quantitation to demonstrate separation. Above 20 percent, secondary degradation produces artefacts that never appear on real-time stability. ICH Q1A(R2) itself does not specify a percentage; this range is industry practice.
Which stress conditions does ICH Q1A(R2) expect?
ICH Q1A(R2) expects stress testing that covers elevated temperature in 10 °C increments above accelerated conditions, humidity where relevant, acid and base hydrolysis across a pH range, oxidation, and photolysis. Photostability is detailed separately in ICH Q1B and uses light exposure rather than time as the dose metric. The guideline gives conditions to cover, not concentrations or durations.
What is an acceptable mass balance in forced degradation?
Closure between roughly 95 and 105 percent is generally accepted. In our example for an oxidative endpoint (assay 72.3 percent against reference standard plus four degradants), total closure was 96.9 percent, which counts as a pass. The degradants are taken without response factors: that assumes equal detector response for parent and degradants, so it should be read as evidence that no large degradant was missed, not as proof of complete recovery.
How do I know when to pull each stress sample?
Run a short kinetics screen with three to five time points and fit the rate. In the analysis of a representative dataset, oxidative stress fitted zero order at 1.9699%/day (R2 0.9982), acid at 1.4871%/day (R2 0.9992) and base at 0.9795%/day (R2 0.9994). From those rates you can set each definitive arm to land in the 5 to 20 percent window instead of guessing at 14 days.
Does forced degradation predict shelf life?
No. Forced degradation identifies degradation pathways and proves the analytical method is stability-indicating. It is run far outside normal storage conditions, so its kinetics do not extrapolate to 25 °C. Shelf life is assigned under ICH Q1E from long-term data, by regression against the one-sided 95 percent confidence bound, with accelerated data supporting only a limited extrapolation.
Can degradation products be predicted before running LC-MS?
Partially. Structure-based prediction enumerates plausible products per pathway. For omeprazole, the prediction gave the sulfone via oxidation at sulfur, mass change +15.99491, exact mass 361.10963. That gives a targeted mass to search for. It is a triage aid: in the matching comparison only one of five peaks was assigned, at 0.5 confidence; another was the drug itself, which belongs out of the peak list before matching.
Related reading
Evaluation for this topic
We evaluate this for your lab.
- ICH stability, Arrhenius fits, shelf life.
- Mass spectra, formula prediction, impurity profiling.