
You have a few milligrams of an ionizable API and a question that decides the next six months: do you formulate the free acid or make a salt? The honest answer needs a pH-solubility profile, and a proper one costs you material and shaker time you may not have yet. A calculated profile will not replace that experiment, but it will tell you where to put your buffers, whether a salt is even worth screening, and which pH points are the ones you actually need to measure.
This article shows how to build that profile, what the numbers mean for salt selection, and, the part most calculators skip, exactly where the calculation stops being physically true.
The two numbers that matter: intrinsic and apparent solubility
For a weak acid, only the neutral (unionized) species is in equilibrium with the solid. Its concentration is the intrinsic solubility, S0, and it is constant regardless of pH. What you measure in a buffer is the apparent solubility: S0 plus whatever ionized species has been generated by the pH.
For a monoprotic acid, the Henderson-Hasselbalch form is:
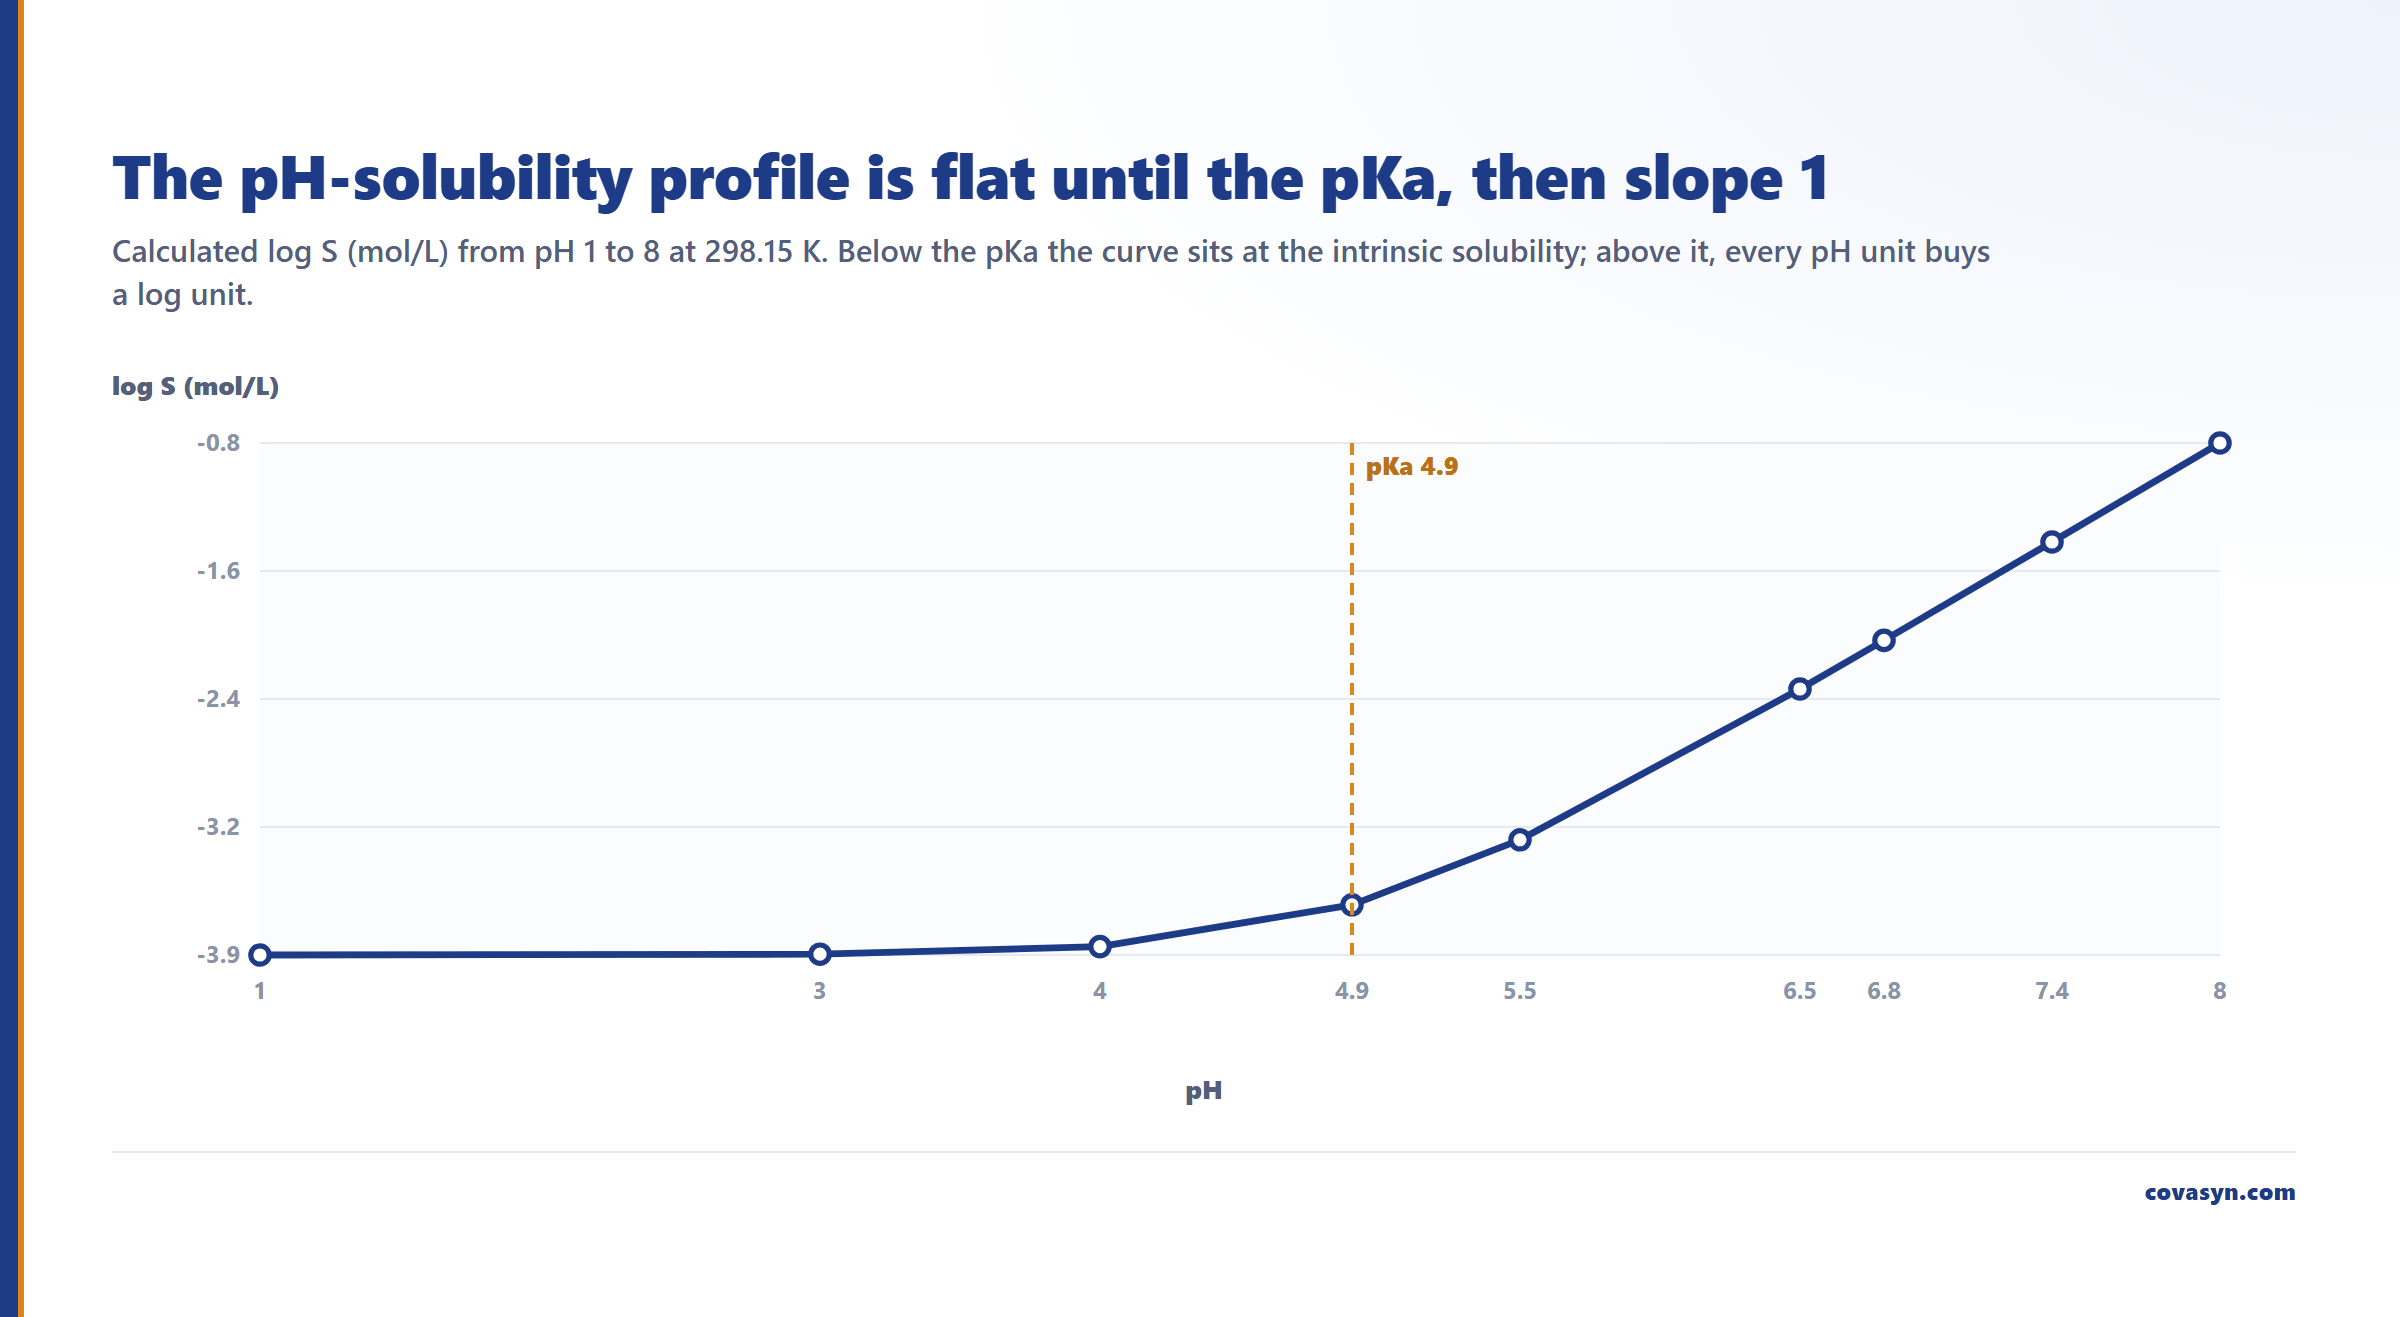
S(pH) = S0 * (1 + 10^(pH - pKa))Below the pKa the correction term is negligible and the curve is flat. Above the pKa the profile rises with a slope of 1 log unit per pH unit. Bases behave the mirror image (flat above the pKa, rising below it), and ampholytes give the classic U-shape with a minimum near the isoelectric point.
Everything downstream, from salt selection to biorelevant dissolution assumptions to the buffer you choose for a stability study, falls out of where your pKa sits relative to the pH you care about.
A worked example: ibuprofen, with real numbers
Ibuprofen is a monoprotic weak acid, literature pKa 4.9. The calculation has two steps.
Step 1: the intrinsic solubility comes from a data-driven prediction model, not from Henderson-Hasselbalch.
CovaSyn's solubility prediction for ibuprofen in water at 298.15 K gave:
| Quantity | Value |
|---|---|
| log S (mol/L) | −3.9446 |
| S | 0.0234 mg/mL (23.4 µg/mL) |
| 95% confidence interval (log S) | −4.153 to −3.736 |
| Model confidence | 0.982 |
| Applicability domain | in domain |
That CI is roughly a factor of 2.6 wide in concentration terms. Carry it forward: every pH-corrected number below inherits it.
Step 2: apply the ionization correction.
With the pKa of 4.9 for an acid, pH 1 to 8 gives this profile (log S in mol/L):
| pH | log S | Note |
|---|---|---|
| 1.0 | −3.9445 | plateau, essentially = S0 |
| 3.0 | −3.9392 | still plateau |
| 4.0 | −3.8931 | correction starts to bite |
| 4.9 (pKa) | ~ −3.64 | S0 doubled, +0.30 log units |
| 5.5 | −3.2473 | |
| 6.5 | −2.3338 | |
| 6.8 | −2.0392 | +1.905 log units vs S0 (~80x) |
| 7.4 | −1.4432 | +2.501 log units vs S0 (~317x) |
| 8.0 | −0.8443 | slope now a clean 1:1 with pH |
At pH 7.4 the result is log S −1.4432, that is 0.0360 mol/L, with an ionization correction of 2.5014 log units. At MW 206.3 that is about 7.4 mg/mL apparent, against 0.023 mg/mL intrinsic.
In the example above the pKa is a literature value. Where the pKa comes from is the single most important thing to state next to any such profile, for the reason in the next section.
The pKa dominates the answer, so source it deliberately
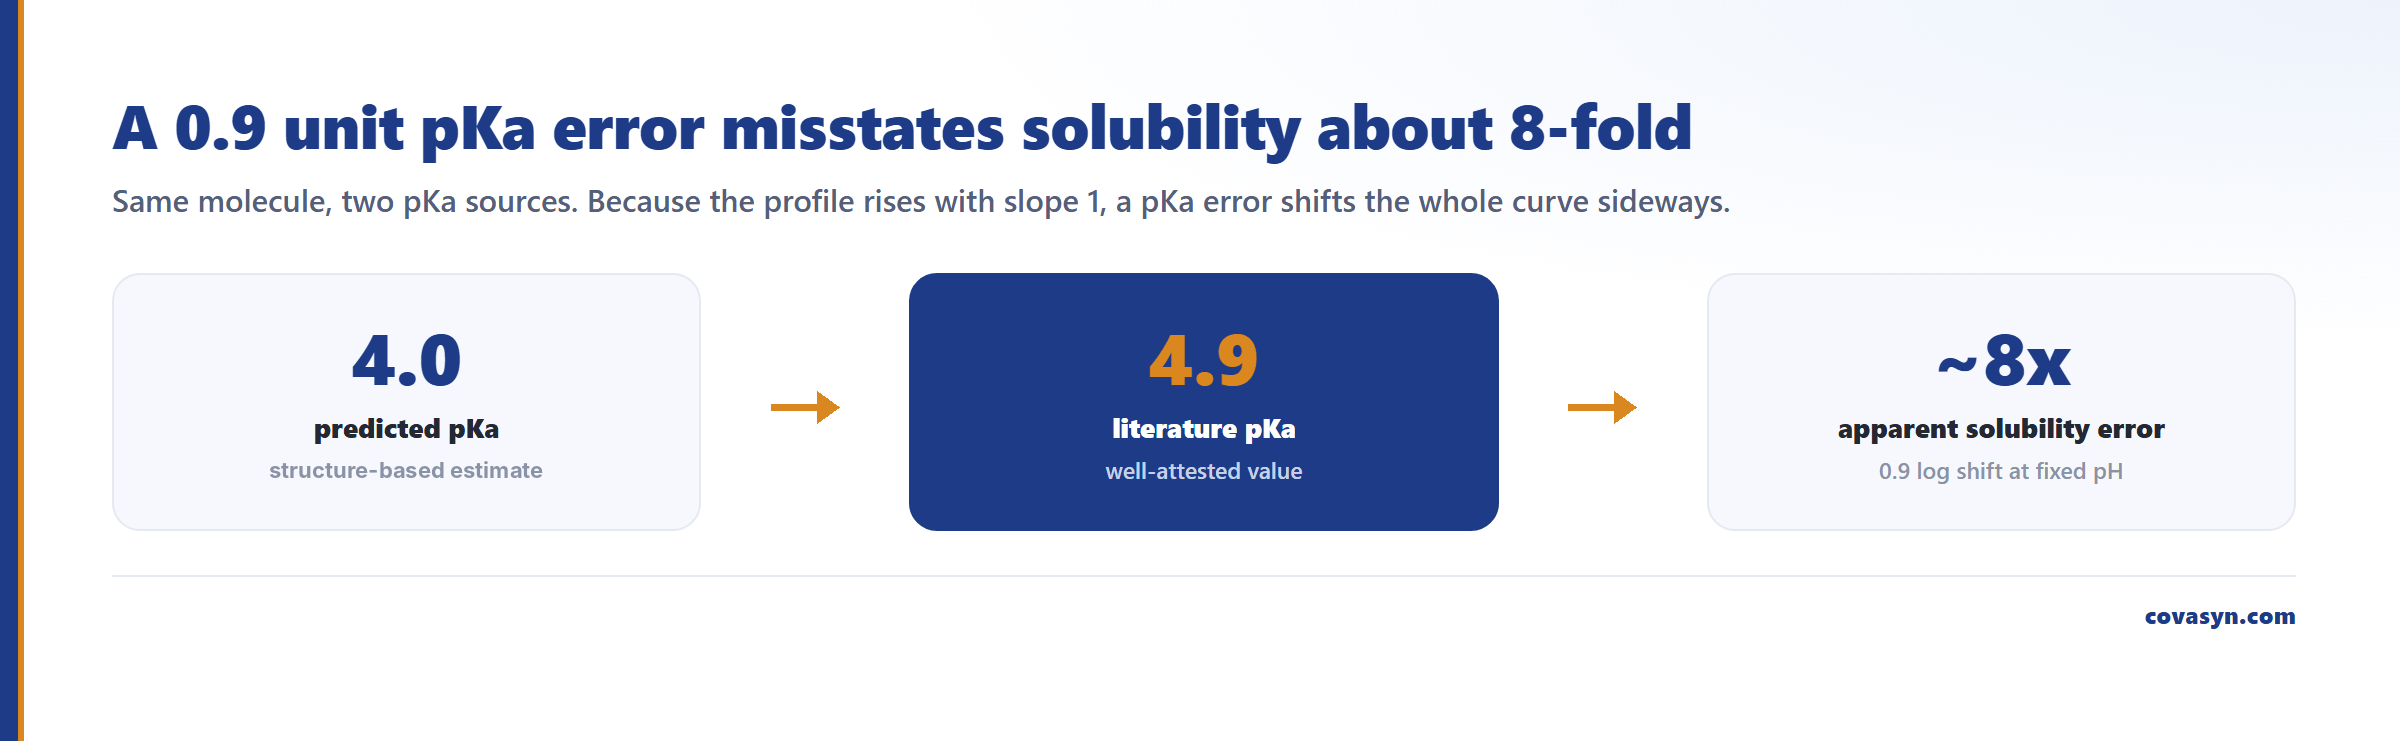
A structure-based pKa prediction gives the same molecule an acidic pKa of 4.0 for the carboxylic acid group (dominant species at pH 7.4: anion). Literature says 4.9.
That 0.9 unit gap is not cosmetic. In the region above the pKa the profile is a straight line with slope 1, so a 0.9 unit error in pKa shifts the entire curve horizontally by 0.9 units and therefore misstates apparent solubility by about 0.9 log units: roughly 8x. It also moves your calculated pHmax by 0.9 units.
Practical rule: use a measured or well-attested literature pKa when you have one, and treat a structure-predicted pKa as a triage input only. Structure-based pKa predictors are reliable at classifying *whether* a group ionizes and poor at the second decimal.
From profile to salt decision: pHmax
A salt is not a molecule with higher solubility. It is a different solid with a different lattice, and it only stays the stable solid form over part of the pH range. The crossover is pHmax.
For a weak acid with a counterion:
pHmax = pKa + log(S_salt / S0)Below pHmax the free acid is the stable solid. Above it, the salt is. Three things follow:
- Your ceiling is the salt's own solubility, not the Henderson-Hasselbalch line. Above pHmax the calculated profile keeps climbing at slope 1 forever. Reality plateaus, because the salt now precipitates and pins the solution concentration at the salt solubility product.
- A salt buys you nothing if pHmax sits outside your route of administration's pH window. For a weak acid with pKa 4.9, gastric pH 1 to 2 is deep in the free-acid region, so an oral salt will convert to the free acid in the stomach. Whether that matters depends on whether the free acid comes down as a fine, fast-redissolving precipitate or as a brick.
- The bigger the gap between pKa and the target pH, the more a salt can theoretically deliver. The calculated 317x gain at pH 7.4 in the table above is the ionization ceiling. That is the number that tells you salt screening is worth material.
The classic screening heuristic still applies: aim for a counterion whose pKa differs from the API's by at least about 3 units (the "rule of three") so the proton transfer is thermodynamically committed and you get a salt rather than a co-crystal or a disproportionating mixture. Use the profile to shortlist; use a wet screen to decide.
What this calculation does not tell you
State these next to the number when you put it in a report.
- It is Henderson-Hasselbalch on top of a model prediction. Two error sources stack: the intrinsic solubility model (95% CI −4.153 to −3.736 log units here) and the pKa you supplied.
- No salt solubility limit. There is no Ksp in this model, so it over-extrapolates above pHmax. Above roughly pH 7 to 8 for this compound, treat the curve as an upper bound, not a prediction.
- No common-ion or counterion effects. A chloride salt in a chloride buffer behaves differently from the same salt in phosphate. The model does not know your buffer species.
- No ionic strength or activity corrections. Thermodynamic and concentration-based constants are used interchangeably here. At high ionic strength that assumption degrades.
- No solid-state information. Polymorphs, hydrates, amorphous content and salt disproportionation all move real solubility and none are inputs.
- No self-association or micellisation. Ibuprofen and many surfactant-like acids aggregate above their CMC, which bends the real curve away from slope 1.
- No kinetics. This is equilibrium solubility. Dissolution rate, surface pH in the diffusion layer and supersaturation lifetime are separate questions.
- Temperature. The run was at 298.15 K. pKa is itself temperature-dependent and that dependence is not modelled.
Used inside those bounds, the profile is decision-support: it tells you where to put your five experimental pH points instead of twelve.
A practical workflow
1. Get the pKa and its provenance. Measured, literature, or predicted: write it down. 2. Predict intrinsic solubility in water and record the 95% CI and the applicability-domain flag. 3. Calculate the profile over the pH range that matters for your route. 4. Read off the ionization gain at your target pH in log units. 5. If that gain is large, estimate pHmax for candidate counterions and check it sits inside your usable pH window. 6. Confirm with a shake-flask measurement at three or four pH points, chosen from the calculated curve, with solid-form characterisation of the residue.
Step 6 is not optional. The calculation exists to make step 6 cheaper.
Frequently asked questions
What is a pH-solubility profile?
A pH-solubility profile plots the equilibrium solubility of an ionizable compound against pH. For a weak acid it is flat below the pKa at the intrinsic solubility value, then rises with a slope of about 1 log unit per pH unit above the pKa. Weak bases show the mirror image. The profile is used to select formulation pH, decide whether a salt form is worth screening, and set biorelevant dissolution conditions.
How much solubility can a salt gain me?
The ionization correction sets the theoretical ceiling. For ibuprofen (pKa 4.9), the calculation gives a correction of +2.501 log units at pH 7.4, about 317x over the intrinsic solubility of 0.0234 mg/mL. The real gain is capped lower by the salt's own solubility product above pHmax, so treat the calculated figure as an upper bound and confirm experimentally.
What is pHmax and why does it matter for salt selection?
pHmax is the pH at which the free form and the salt are equally stable as solids. For a weak acid it is approximately pKa + log(S_salt / S0). Below pHmax the free acid is the stable solid; above it the salt is. It matters because a salt only delivers its solubility advantage above pHmax, and a Henderson-Hasselbalch curve keeps rising past that point when real solubility plateaus.
Where does Henderson-Hasselbalch over-predict solubility?
It over-predicts above pHmax, because it contains no salt solubility product and therefore extrapolates a slope-1 line indefinitely. It also ignores common-ion effects, ionic strength and activity coefficients, self-association or micelle formation above the CMC, and any solid-form change such as hydrate or polymorph conversion. All of these bend the real curve downward relative to the calculation.
Can I use a predicted pKa instead of a measured one?
For triage, yes. For a decision, be careful. A structure-based prediction gives 4.0 for ibuprofen's carboxylic acid against a literature value of 4.9. Because the profile rises with slope 1 above the pKa, that 0.9 unit error shifts the whole curve horizontally and misstates apparent solubility by roughly 8x at a fixed pH. Always record which pKa source you used.
How accurate is the intrinsic solubility that feeds the profile?
For ibuprofen in water at 298.15 K, our solubility prediction returned log S = −3.945 mol/L with a 95% confidence interval of −4.153 to −3.736, model confidence 0.982, and the compound flagged as inside the applicability domain. That interval is about a factor of 2.6 in concentration. Every pH-corrected value inherits it, so report the profile as a band, not a line.
Related reading
Evaluation for this topic
We evaluate this for your lab.
- Solubility, pH, crystallization, antisolvent.