

Dissolution is one of the few release tests where the analytics are trivial and the decision is not. Absorbance to percent-released takes a line of code. Deciding whether a post-change batch is still the same product, whether the medium was ever in sink, and whether UV was the right detector at all is where the time goes and where audits find problems.
This walks the full chain: calibration, method validation, profile calculation, f1/f2 comparison, sink-condition check. Every number comes from a genuine calculation by CovaSyn's dissolution analysis. The dataset is a constructed 10 mg immediate-release tablet in 900 mL, not a GMP batch: the arithmetic is real, the sample is illustrative.
Step 1: the calibration curve
Everything downstream inherits the calibration. Run standards across the expected range and fit before you touch a vessel.
Five standards from 2 to 20 µg/mL:
| Metric | Value |
|---|---|
| Slope | 0.07143 AU per ug/mL |
| Intercept | 0.00129 AU |
| r-squared | 0.9999975 |
| n standards | 5 |
| Back-calculated unknown at 0.512 AU | 7.149 µg/mL |
An r-squared of 0.9999975 looks impressive and means almost nothing on its own; five points on a straight line will do that. The number that matters is whether the intercept is statistically distinguishable from zero, because a non-zero intercept is the fingerprint of a matrix or baseline problem that biases every low timepoint. That question is answered in the next step.
Step 2: validate the method before you trust a profile
The validation runs linearity, accuracy and precision together against ICH Q2(R2) expectations. Same five standards, spiked recoveries at 80, 110 and 140 percent of working concentration, and two days of six replicates:
| Element | Result | Verdict |
|---|---|---|
| Linearity r-squared | 0.9999975 | pass |
| Standard error of intercept | 0.000806 AU | - |
| Intercept significant vs zero | false | pass |
| Mean recovery | 99.77% | pass |
| Individual recoveries | 99.0%, 101.2%, 99.1% | pass |
| Accuracy RSD | 1.22% | pass |
| Repeatability RSD | 0.510% | pass |
| Intermediate precision RSD | 0.573% | pass |
| Overall | pass | - |
The useful line is the one on intercept significance. The intercept is 0.00129 AU against a standard error of 0.000806 AU, so it does not clear the significance threshold: evidence that the blank-corrected baseline is behaving. If the intercept were significant, the fix is not a better regression; it is finding the excipient, filter or dissolved-gas artefact putting absorbance where there is no analyte.
Repeatability at 0.510% RSD and intermediate precision at 0.573% RSD sit close together. A large gap between them signals an analyst, day or instrument effect worth chasing before the method reaches QC.
Step 3: the dissolution profile
From the timepoints, the raw absorbances, the calibration slope and intercept, the label claim and the vessel volume follow the percent released and the conventional Q points.
Two batches against the same reference profile, USP Apparatus 2 style sampling at 5, 10, 15, 20, 30, 45 and 60 minutes:
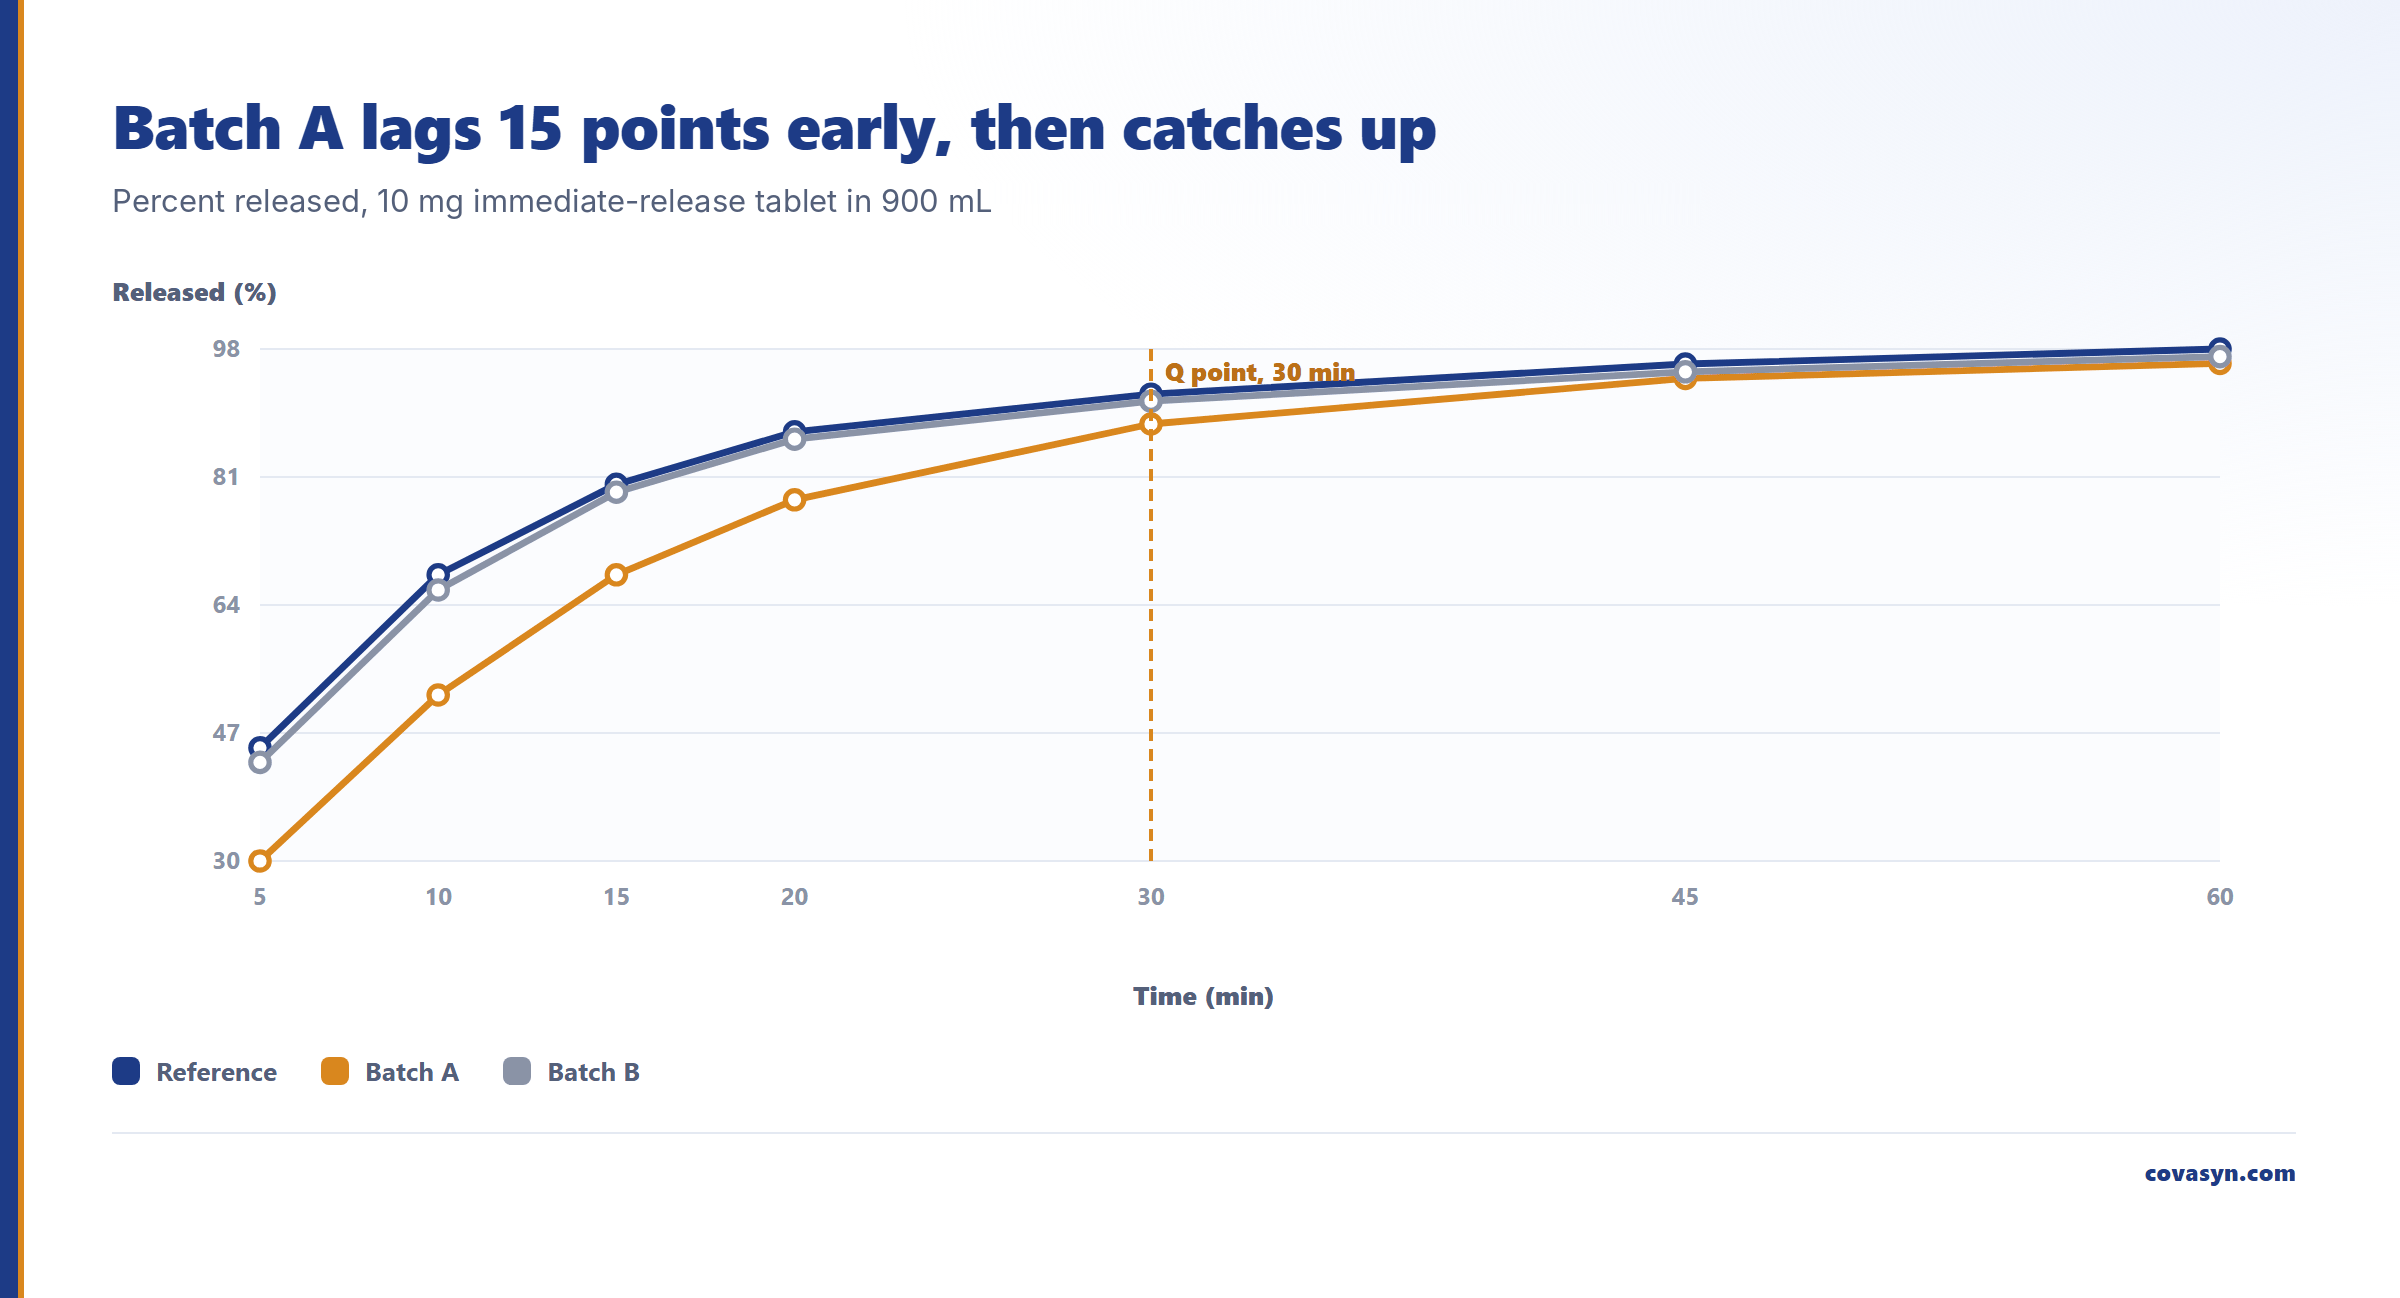
| Time (min) | Reference (%) | Batch A (%) | Batch B (%) |
|---|---|---|---|
| 5 | 45.0 | 29.95 | 43.05 |
| 10 | 68.0 | 52.00 | 65.98 |
| 15 | 80.0 | 68.00 | 78.96 |
| 20 | 87.0 | 77.95 | 86.02 |
| 30 | 92.0 | 88.03 | 91.05 |
| 45 | 96.0 | 94.08 | 94.96 |
| 60 | 98.0 | 96.09 | 96.98 |
Batch A and Batch B percentages are calculated. Q at 30 minutes: 88.03% for A, 91.05% for B. Against a typical Q = 80% at 30 minutes acceptance criterion, both batches pass the single-point test comfortably. That is the trap.
f1 and f2: where the two batches separate
The single Q point says both batches are fine. Profile comparison says they are not the same product.
f2 is the similarity factor from the FDA and EMA dissolution guidances; similar profiles give f2 between 50 and 100. f1 is the difference factor, accepted band 0 to 15. Both use only the timepoints up to and including the first point at which both profiles exceed 85 percent dissolved, so the plateau cannot inflate similarity.
Computed from the percent-released values using the published FDA formula:
| Batch | Points used | f2 | f1 | Similar? |
|---|---|---|---|---|
| A | 5, 10, 15, 20, 30 min (n = 5) | 45.9 | 15.1 | No |
| B | 5, 10, 15, 20 min (n = 4) | 86.5 | 2.1 | Yes |
Batch A fails both criteria: f2 of 45.9 is below 50, f1 of 15.1 is just over the limit. The mechanism is visible in the table: A lags by 15 percentage points at 5 minutes and 16 at 10 minutes, then catches up. Slower early release with the same endpoint is the classic signature of a disintegration or wetting change, and exactly what a single 30-minute Q point cannot see. Batch B, at f2 = 86.5, is indistinguishable from reference.
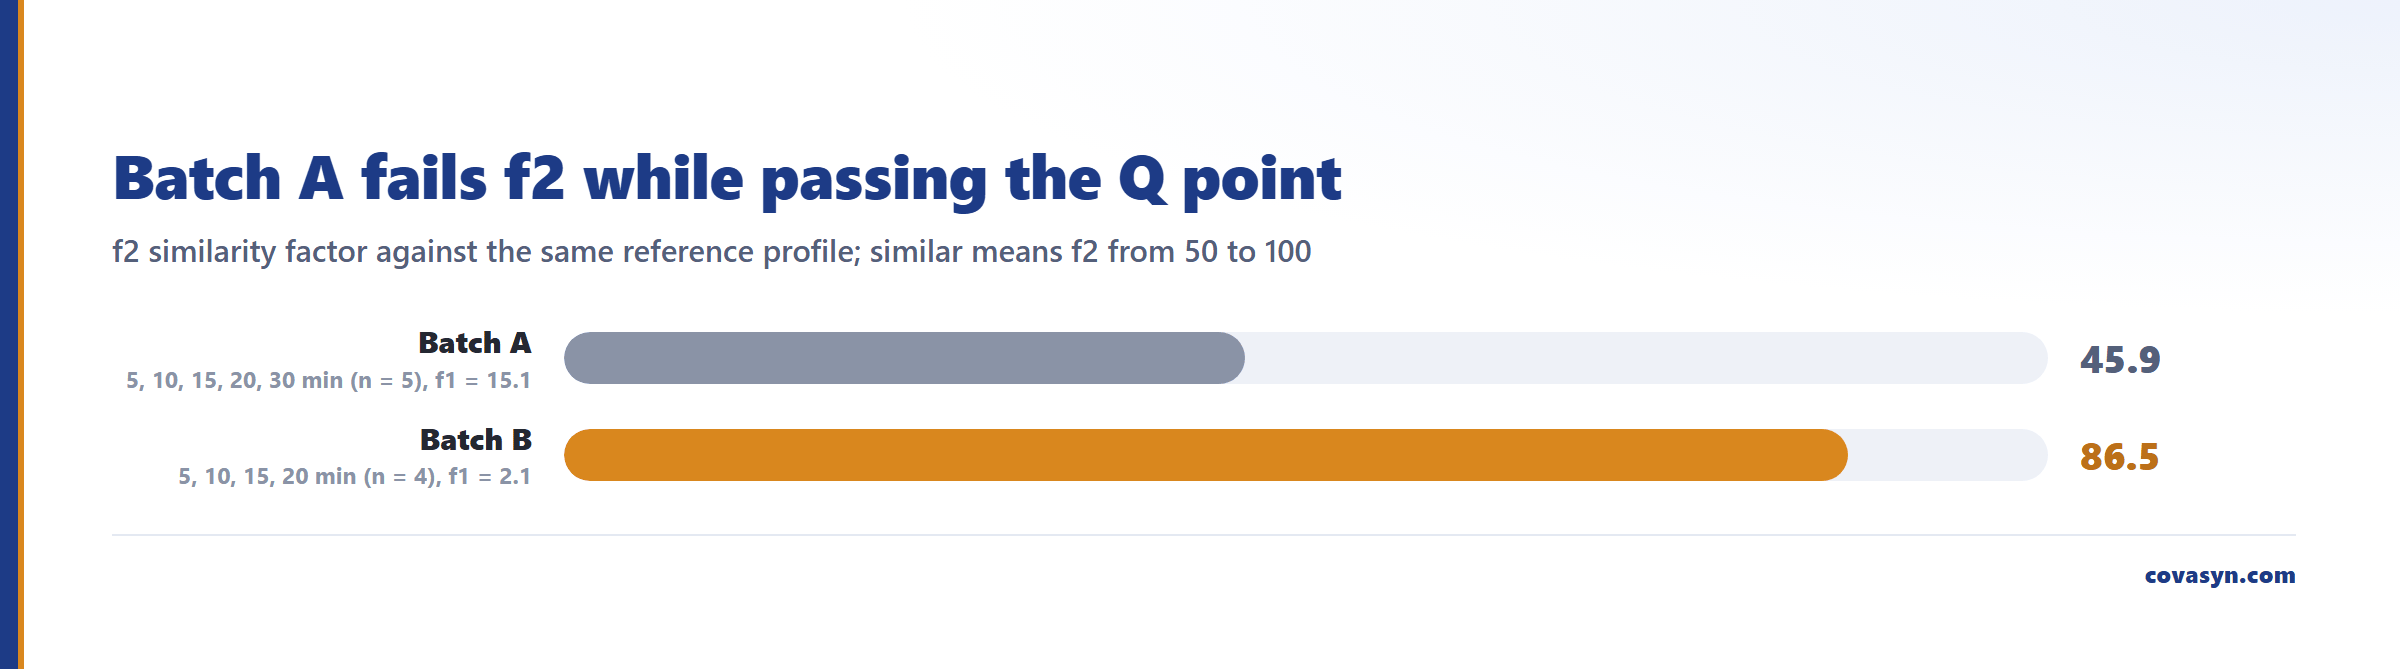
Two cautions. f2 is a point estimate with no confidence interval, so it is fragile at the boundary; an f2 of 51 is not defensible without bootstrapping. And both guidances expect the coefficient of variation across the 12 units to be no more than 20 percent at early timepoints and 10 percent thereafter. f2 on mean profiles from noisy vessels is not evidence.
Sink conditions: check before, not after
Sink conditions mean the medium can dissolve at least three times the dose (many labs use a stricter factor). Outside sink, the rate becomes solubility-limited and the profile stops describing the formulation.
For a 10 mg dose in 900 mL, the fully dissolved concentration is 0.0111 mg/mL. CovaSyn's solubility prediction for amlodipine free base in water at 310.15 K returns 2.88 mg/mL (log S −2.15 mol/L), inside the applicability domain, 95% confidence interval −2.62 to −1.68 in log units: roughly 0.97 to 8.6 mg/mL. Even at the pessimistic bound the medium holds about 87 times the dose, so sink is not the constraint here.
The caveat: that is a predicted intrinsic aqueous solubility, not a measurement in your buffered medium with surfactant. Use it to decide whether a sink problem is plausible and whether a measurement is worth doing. Never put a predicted number in a protocol.
Where UV falls down and HPLC does not
UV is fast, cheap, non-destructive and easy to automate inline. It is also non-selective, and every one of its failure modes traces back to that.
- Excipient interference. Povidone, some colourants and several coating polymers absorb in the same 240 to 300 nm window as many APIs. The bias is positive and largest at early timepoints, when analyte signal is smallest. Blank-corrected placebo vessels are the minimum defence.
- Degradants. UV cannot separate a degradation product with a similar chromophore from the parent. A profile can look correct while the number is partly degradant.
- Turbidity. Scattering adds apparent absorbance. Filtration helps, but filter adsorption of the API is its own bias and must be validated.
- Bubbles. Dissolved gas on the cuvette or probe window produces sporadic high readings that look like real data.
- Low-dose products. Below roughly 1 to 2 µg/mL in medium, UV precision degrades and may not reach the sensitivity a 5-minute timepoint needs.
HPLC-UV costs cycle time and solvent and buys selectivity. Practical rule: use UV when the placebo is spectrally clean, the product is stable, and the dose gives a comfortable working concentration. Move to HPLC for absorbing excipients, stress or stability samples, related substances that must be resolved from the parent, or any case where a regulator will ask you to prove selectivity rather than assert it.
Honest limits
What this analysis does not tell you:
- Nothing about in vivo behaviour. f2 similarity is a quality-control comparability tool. It is not a bioequivalence claim, and only supports a biowaiver inside the specific conditions of the relevant BCS guidance.
- Nothing about the 12 units. Everything above is mean-profile arithmetic. Unit-to-unit variability, and the stage 1 to stage 3 USP acceptance tables, are a separate analysis.
- Nothing about selectivity. The validation above covers linearity, accuracy and precision. It does not prove the absorbance came from your API rather than an excipient. That needs a placebo study or an orthogonal method.
- Nothing about the medium. The calculation takes the volume you give it. Evaporation, sampling replacement volume and degassing state are assumptions you carry in.
- The solubility figure is a prediction. 2.88 mg/mL with an interval spanning nearly an order of magnitude is a triage number, not a specification input.
Frequently asked questions
How is the f2 similarity factor calculated?
f2 = 50 x log10 of (100 divided by the square root of 1 plus the mean squared difference between the reference and test percent-dissolved values). Use at least three timepoints, exclude points after the first at which both profiles exceed 85 percent dissolved, and use the same timepoints for both profiles. Values from 50 to 100 indicate similarity. In the worked example above, Batch A returned f2 = 45.9 and Batch B returned f2 = 86.5 against the same reference.
Can a batch pass the Q acceptance criterion and still fail f2?
Yes, and it is common. Q is a single-point test, usually 80 percent at 30 minutes. f2 compares the whole profile shape. In the example in this article, Batch A gave a Q value of 88.03 percent at 30 minutes, comfortably passing Q = 80 percent, while its f2 of 45.9 against the reference profile failed the similarity criterion because it released 15 percentage points less at 5 minutes.
What are sink conditions in dissolution testing?
Sink conditions exist when the dissolution medium can dissolve at least three times the dose being tested, so that the measured rate reflects the formulation rather than saturation. For a 10 mg dose in 900 mL, the fully dissolved concentration is 0.0111 mg/mL; a predicted solubility of 2.88 mg/mL aqueous solubility corresponds to roughly 260 times the dose, so sink is comfortably met. Confirm with a measured solubility in the actual medium.
When should I use HPLC instead of UV for dissolution?
Use HPLC when selectivity matters: absorbing excipients such as povidone or coating polymers overlapping the API band, stability or forced-degradation samples where degradants share the chromophore, multi-API products, or low-dose products where UV sensitivity is marginal. UV remains the better choice for spectrally clean, stable, single-API immediate-release products, where it is faster, cheaper and non-destructive.
What does an ICH Q2(R2) UV method validation need to show?
At minimum linearity, accuracy and precision across the working range, plus specificity. The validation of the example method returned r-squared 0.9999975 with the intercept not significantly different from zero, mean recovery 99.77 percent with 1.22 percent RSD across three levels, repeatability 0.510 percent RSD and intermediate precision 0.573 percent RSD, giving an overall pass. Specificity is not covered by that calculation and needs a placebo or orthogonal study.
Why does the intercept of my calibration curve matter more than r-squared?
r-squared is almost always high for a five-point straight line and hides bias. A statistically significant non-zero intercept means absorbance is present where analyte is not, usually from excipient background, scattering or a baseline offset. That bias is proportionally largest at early dissolution timepoints, precisely where profile comparison is most sensitive, so it can flip an f2 result.
Related reading
Evaluation for this topic
We evaluate this for your lab.
- UV/Vis quantification, dissolution, bioanalytics.