
You have a new molecule going onto shared equipment and two questions land on the same desk. How little residue is acceptable in the next product, and can your existing clean-in-place cycle actually get down to that number. If the compound is mutagenic, the answer to the first question stops being a toxicology exercise and becomes a default: 1.5 µg/day. This piece walks the decision, the arithmetic, and the cleanability check that most limit calculations skip.
PDE and TTC are not alternatives: they are two branches of one decision
A cleaning limit is derived from a health-based exposure limit (HBEL). Two routes exist and the compound decides which one you are on.
The PDE (permitted daily exposure)
is the compound-specific route, described in ICH Q3C(R8) Appendix 3 and in the EMA guideline on setting health-based exposure limits for shared facilities (EMA/CHMP/CVMP/SWP/169430/2012, in force since June 2015). You take the most relevant point of departure, usually a NOAEL or NOEL from a repeat-dose study, sometimes a clinical LOEL, and divide by a chain of adjustment factors:
PDE = (PoD x weight adjustment) / (F1 x F2 x F3 x F4 x F5 x alpha)F1 covers interspecies extrapolation, F2 interindividual variability (usually 10), F3 study duration, F4 severe toxicity, F5 use of a LOEL instead of a NOAEL. The output is a defensible mg/day or µg/day figure that is specific to your molecule. It requires data.
The TTC (threshold of toxicological concern)
is the default when the compound is a mutagen and you do not have compound-specific carcinogenicity data. ICH M7(R2) sets an acceptable intake of 1.5 µg/day for a mutagenic impurity at lifetime exposure, corresponding to a theoretical excess cancer risk of 1 in 100,000. It is not a measured potency. It is the value the regulation assigns when the mechanism is presumed non-threshold and you cannot do better.
The practical consequence: a PDE for a moderately toxic API often lands in the hundreds of µg/day to low mg/day. A TTC-based limit is 1.5 µg/day. That is typically two to four orders of magnitude tighter, and it is the difference between a cleaning process that passes and one that does not.
| PDE / HBEL | TTC | |
|---|---|---|
| When it applies | Compound-specific tox data available; non-mutagenic or threshold mechanism | Mutagenic without compound-specific carcinogenicity data (ICH M7 Class 2 or 3) |
| Basis | NOAEL/LOEL + adjustment factors | Regulatory default, 1 in 100,000 lifetime cancer risk |
| Typical magnitude | mg/day to hundreds of µg/day | 1.5 µg/day (lifetime) |
| Governing text | ICH Q3C(R8) App. 3; EMA/CHMP/CVMP/SWP/169430/2012 | ICH M7(R2) |
| What decides it | Toxicology package | Mutagenicity call (structure + QSAR) |
So the first question in a cleaning validation is not "what is the PDE". It is: is this compound mutagenic? Everything downstream hangs on that call.
Worked example: chlorambucil, from structure to a cleaning route
Chlorambucil (SMILES OC(=O)CCCc1ccc(N(CCCl)CCCl)cc1, InChIKey JCKYGMPEJWAADB-UHFFFAOYSA-N) is an alkylating cytotoxic: a realistic HPAPI to put on shared equipment.
Step 1: the mutagenicity call
Chlorambucil is a known mutagenic carcinogen with carcinogenicity data. For cleaning validation, the EMA guideline on health-based exposure limits therefore calls for a compound-specific limit derived from those data, not the TTC. The structural assessment confirms the mechanism, with a statistical model score of 0.6348. Two mutagenicity alerts fire on the same structure:
- nitrogen mustard motif: high severity, mechanism aziridinium ion formation leading to DNA cross-linking
- alkyl halide: SN2 alkylation of DNA
Both the expert-rule and the statistical arm of the assessment are positive, which is exactly the ICH M7 two-complementary-methodologies pattern. There is no negative-prediction conflict to resolve here.
Be precise about what happened next.
The 1.5 µg/day is not a result of the assessment: it is the regulatory default for a mutagenic compound without its own carcinogenicity data. Anyone who tells you a QSAR model "predicted a TTC of 1.5 µg/day" has misread the result. In the calculation below we use 1.5 µg/day purely as a placeholder for the compound-specific value set by your toxicologist.
Step 2: what that does to the carryover limit
With the placeholder of 1.5 µg/day, the maximum allowable carryover into the next product follows the standard form:
MACO = AI (µg/day) x minimum batch size of next product / maximum daily dose of next productTake illustrative downstream figures (assumptions for the arithmetic, not computed results or measurements): next product batch size 200 kg, maximum daily dose 400 mg. Then
MACO = 1.5 µg/day x 200,000,000 mg / 400 mg/day = 750,000 µg = 0.75 g across the whole 200 kg batch.
Spread over a shared train with, say, 20 m² of product-contact surface, that is 3.75 µg/cm², or roughly 94 µg on a 25 cm² swab, before you apply your recovery factor and analytical limit of quantitation. With the compound-specific value from your toxicologist this figure can drop by orders of magnitude; then the analytical method becomes the constraint.
Step 3: can you actually remove it?
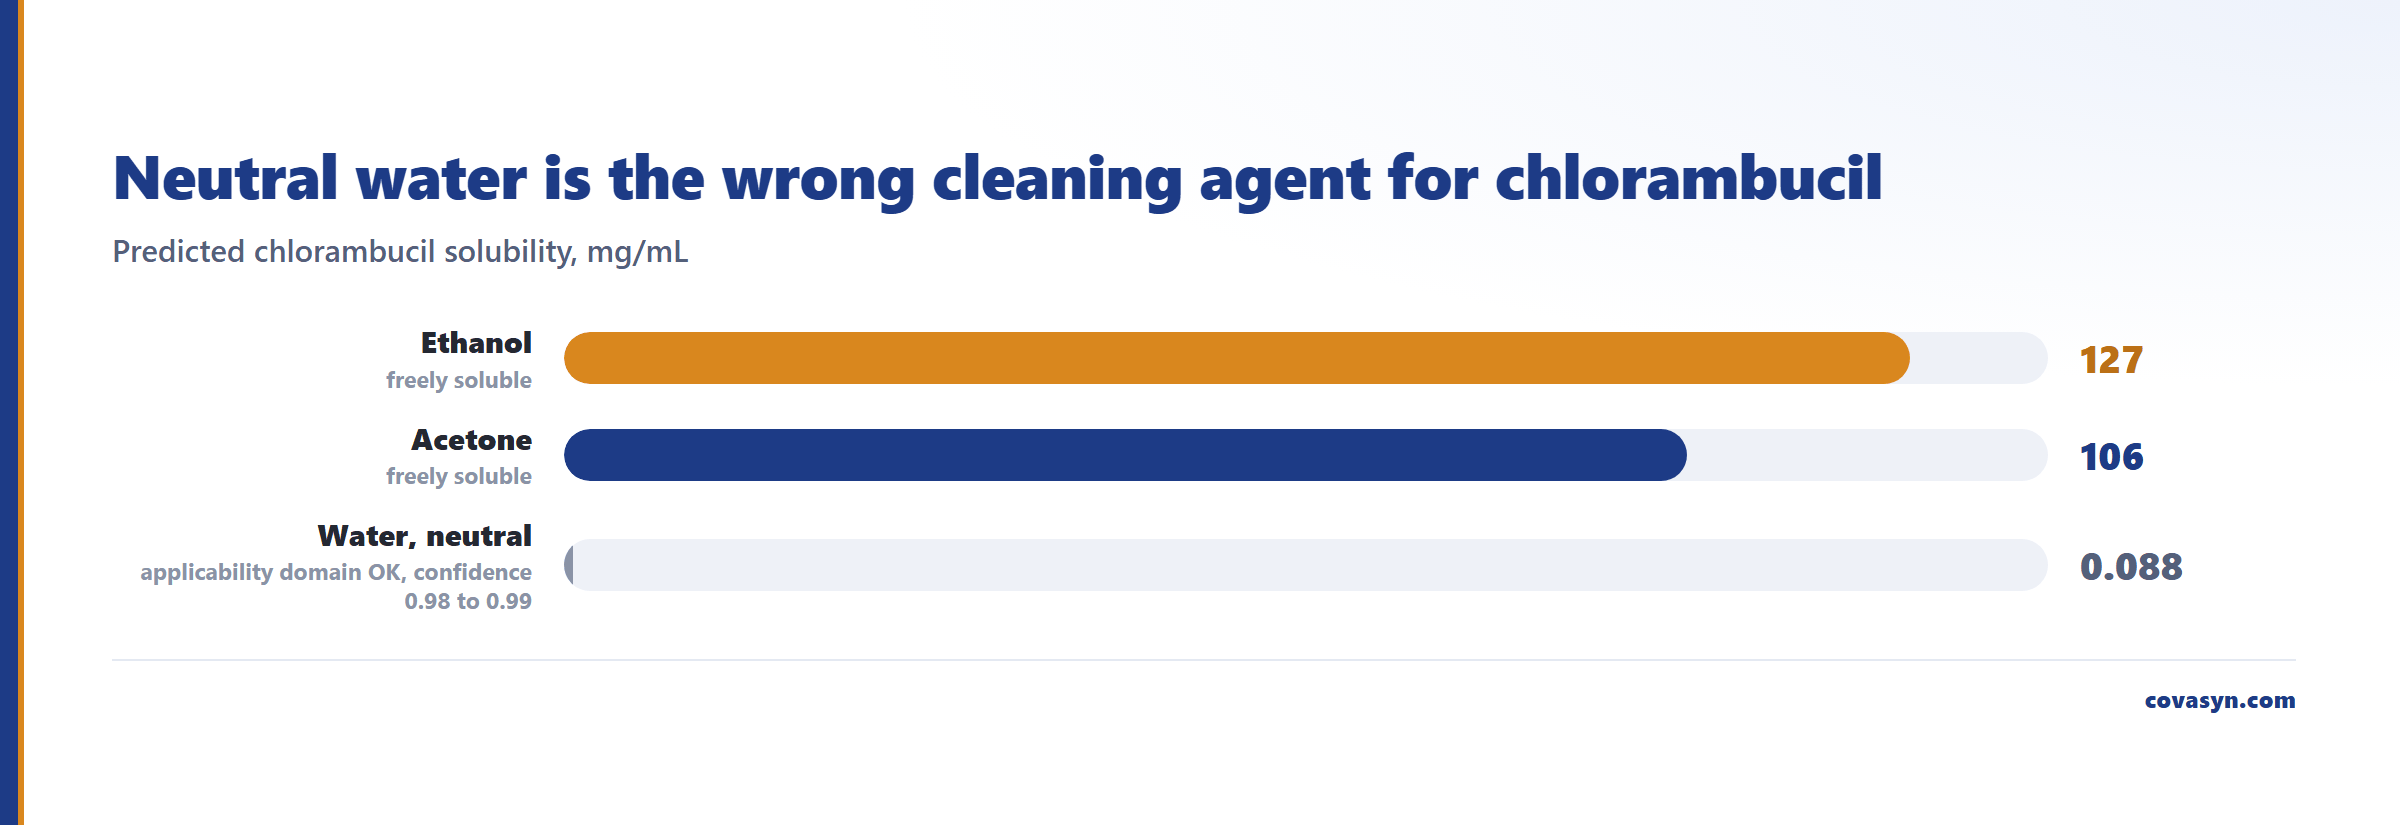
A limit you cannot reach is not a control strategy. Our solubility prediction gives chlorambucil solubility across candidate cleaning agents:
| Cleaning agent | Predicted solubility | Note |
|---|---|---|
| Water, neutral | 0.088 mg/mL | applicability domain OK, confidence 0.98 to 0.99, 95% CI reported |
| Ethanol | 127 mg/mL | freely soluble |
| Acetone | 106 mg/mL | freely soluble |
A neutral water flush is roughly three orders of magnitude weaker as a solvent than ethanol here. For a residue you are allowed to leave behind only in micrograms, that matters.
There is a cheaper option than a solvent rinse. Chlorambucil is a carboxylic acid. The pH-dependent solubility view returns a pKa of 5.8 and a +5.20 log-unit solubility correction at pH 11: roughly a 10^5 gain over the neutral case. An alkaline CIP cycle (dilute NaOH) ionizes the acid and does the work. The SOP writes itself: alkaline wash or organic solvent, not a plain water rinse.
Caveat, stated plainly: the pH-solubility figure is a Henderson-Hasselbalch estimate and is reported as a relative log-unit gain, not an absolute mg/mL. H-H extrapolation to pH 11 overshoots the true intrinsic ceiling badly. Use it to rank cleaning agents and to justify an alkaline cycle. Do not put the extrapolated absolute number in a protocol.
What this does not tell you
- It does not produce a filed limit. The structural mutagenicity assessment is a triage output. A regulatory submission needs the ICH M7 two-methodology assessment documented, with expert review of any conflicting or out-of-domain prediction.
- QSAR accuracy has a ceiling. Our Ames endpoint scores balanced accuracy 0.736 on a scaffold holdout of n = 1089 (0.848 on a random split). Scaffold holdout is the honest generalisation number and it is the one to quote. Some endpoints in the same panel are worse and some test sets are small: for this molecule, several endpoints are explicitly flagged as out-of-domain. Read the flags.
- Solubility predictions are predictions. On a held-out aqueous test set our solubility prediction reaches R² 0.91 and RMSE 0.69 log, about 76% of predictions within 0.5 log. That is good enough to rank water against ethanol against an alkaline cycle. It is not a substitute for a solubility measurement in your actual cleaning agent at your actual temperature.
- Nothing here replaces the swab study. Recovery factors, surface material effects, dried-residue kinetics, hold times, worst-case location selection: all of that is wet-lab work. In-silico gets you a defensible starting hypothesis and stops you running a cleaning study that was never going to work.
- The TTC has qualifiers. 1.5 µg/day is the lifetime figure. Less-than-lifetime (LTL) exposure allows higher intakes; cohort-of-concern compounds (aflatoxin-like, N-nitroso, azoxy) are excluded from the generic TTC entirely and need compound-specific limits.
Frequently asked questions
When do you use a PDE and when do you use the TTC in cleaning validation?
Use a compound-specific PDE when adequate toxicology data exists and the mechanism is threshold-based; it follows ICH Q3C(R8) Appendix 3 and the EMA health-based exposure limit guideline. Use the TTC of 1.5 µg/day when the compound is mutagenic under ICH M7 and you have no compound-specific carcinogenicity data. The mutagenicity call decides the branch, so make that call first.
Is 1.5 µg/day a measured potency value?
No. It is a regulatory default. ICH M7 assigns an acceptable intake of 1.5 µg/day to a mutagenic impurity at lifetime exposure, corresponding to a theoretical excess cancer risk of 1 in 100,000. Software that flags a compound as mutagenic has not predicted the 1.5 µg/day figure: the guideline attaches that number to the classification as long as no compound-specific data exist.
What does an ICH M7 Class 2 result mean for a cleaning limit?
Class 2 means a known mutagen with unknown carcinogenic potential. The acceptable intake then falls to the TTC of 1.5 µg/day as long as no compound-specific data exist. That typically tightens the maximum allowable carryover by two to four orders of magnitude and often makes the analytical limit of quantitation the binding constraint.
How do you know whether a residue is even cleanable?
Compare its solubility across the cleaning agents you actually run. For chlorambucil, our solubility prediction gives 0.088 mg/mL in neutral water against 127 mg/mL in ethanol and 106 mg/mL in acetone, so a water flush is the wrong choice. Because it is an acid with pKa 5.8, the pH-dependent view shows a 5.2 log-unit gain at pH 11, pointing at an alkaline CIP cycle.
Can in-silico predictions replace a swab recovery study?
No. They set the hypothesis and the sequence. Structure-based triage tells you which limit branch applies and which cleaning agent is worth testing, before you commit equipment time. Recovery factors, coupon studies on real contact materials, dried-residue behaviour and worst-case location selection remain wet-lab work, and the validated protocol is what a regulator reviews.
What accuracy should I expect from a mutagenicity QSAR?
Quote the scaffold-holdout number, not the random-split one. We reach balanced accuracy 0.736 for Ames on a scaffold holdout of 1089 test compounds, versus 0.848 on a random split; the gap is what happens when the test molecules have unseen cores. Always check the applicability-domain flag: an out-of-domain prediction is a prompt for expert review, not a result.
Related reading
Evaluation for this topic
We evaluate this for your lab.
- ICH M7, Tox21, CYP450, structural alerts, ADMET triage.
- Solubility, pH, crystallization, antisolvent.