
Key takeaways
- Shelf life is capped by the climate chamber: months of waiting before you know whether a formulation holds.
- CovaStab turns a few weeks of multi-temperature data into a shelf-life estimate in minutes, so formulations can be prioritized early.
- On the amoxicillin example: activation energy Ea ≈ 65 kJ/mol, model selection by AIC, extrapolation to 5 °C and 25 °C.
- The teaching point: the limiting parameter is the degradation product, not assay: the "obvious" CQA is not the decisive one.
- Honest: data illustrative, analysis real; and the tool itself signals when extrapolation does not replace the real-time study.
The bottleneck is the climate chamber
Every formulation decision eventually waits for the same answer: how long is the product shelf-stable? Classically the real-time stability study answers this: months to years in the climate chamber, with limited chamber capacity and under time pressure. For early prioritization across multiple formulation candidates, that is too slow.
The established shortcut is accelerated stability: measure degradation at elevated temperatures and extrapolate via the Arrhenius equation to the storage temperature. We show on a reconstituted amoxicillin suspension (degradation by β-lactam ring hydrolysis, a single dominant mechanism) how CovaStab runs this chain in minutes. Up front, the honest framing: the stability data here are illustrative and literature-anchored: the analysis itself runs through the real CovaStab engine.
Step 1: Degradation curves and model selection
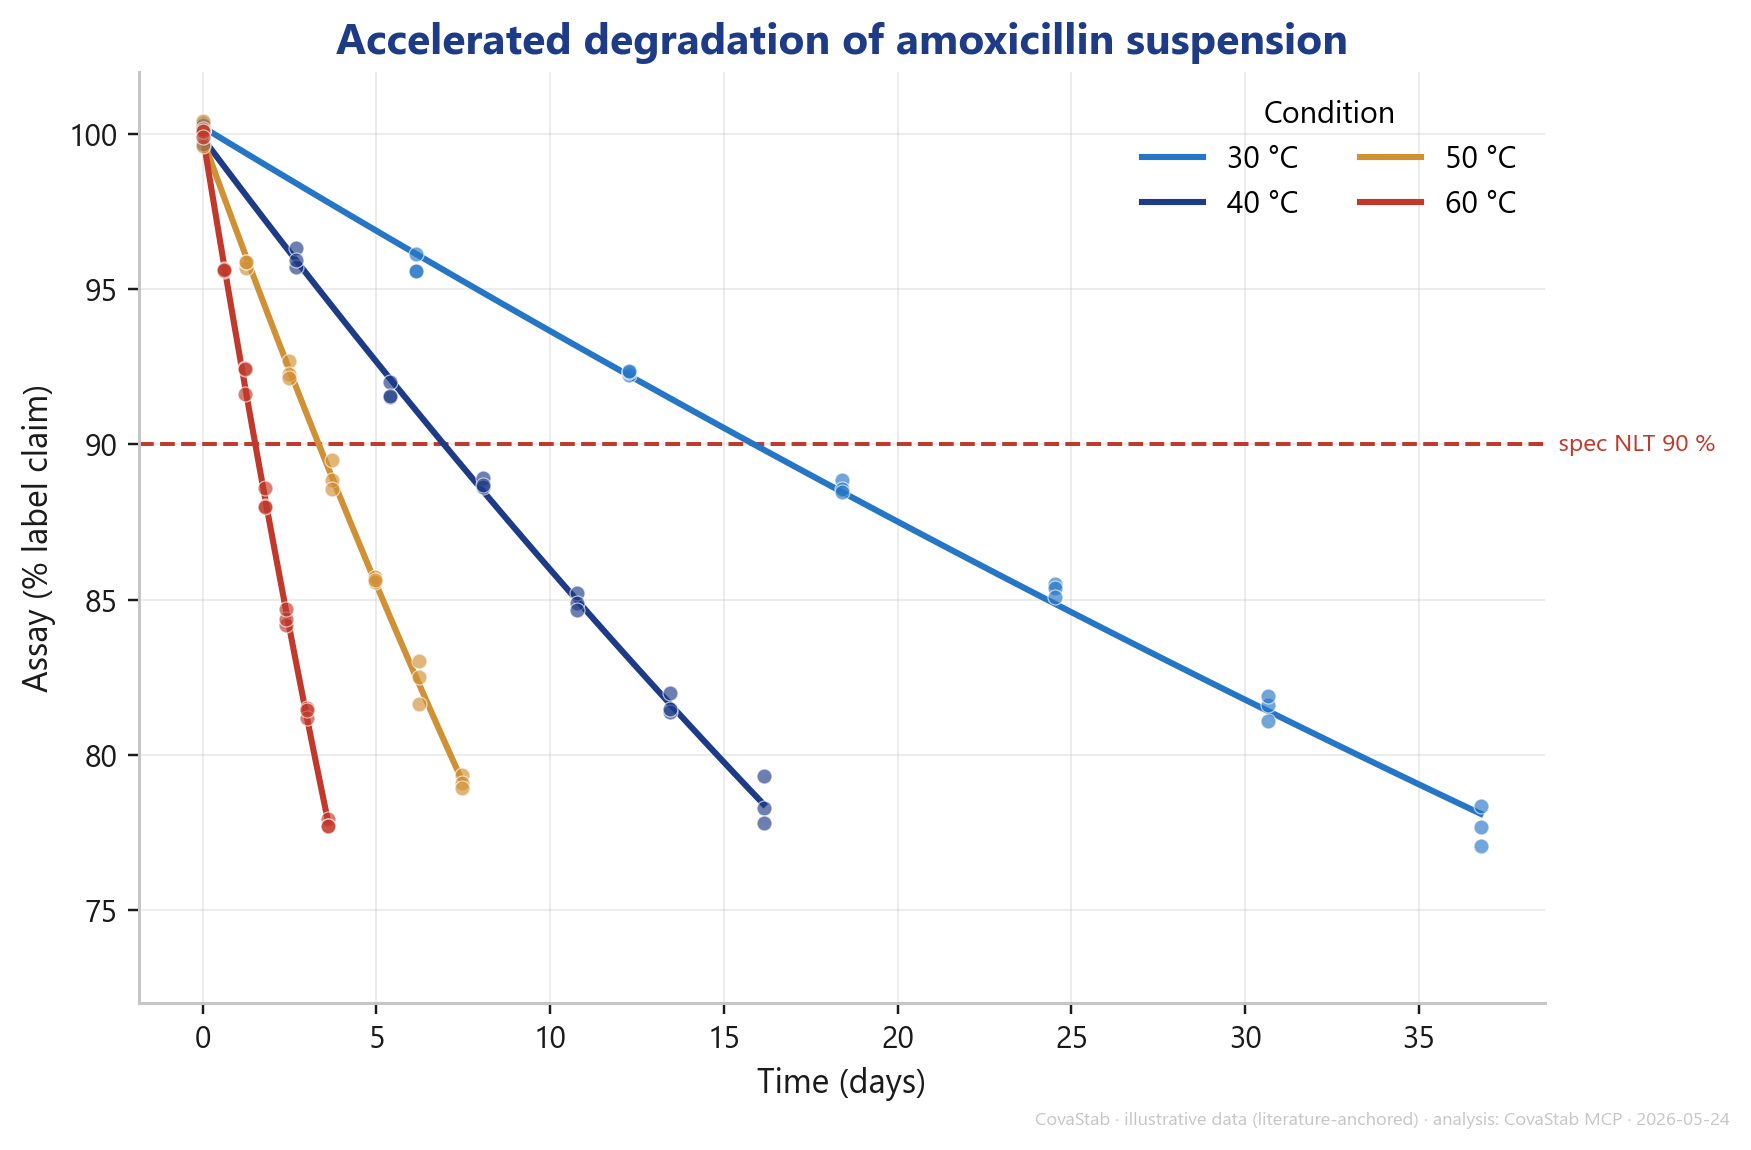
First the accelerated data: assay (% label claim) versus time at four temperatures (30/40/50/60 °C), three batches. The temperature dependence is drastic: what takes ~19 days at 30 °C is over in under 2 days at 60 °C.
Crucially, CovaStab does not assume the reaction order, it determines it: zero-, first- and second-order are fitted and compared by AIC. First order wins clearly (lowest AIC, R² = 0.999): consistent with β-lactam hydrolysis.
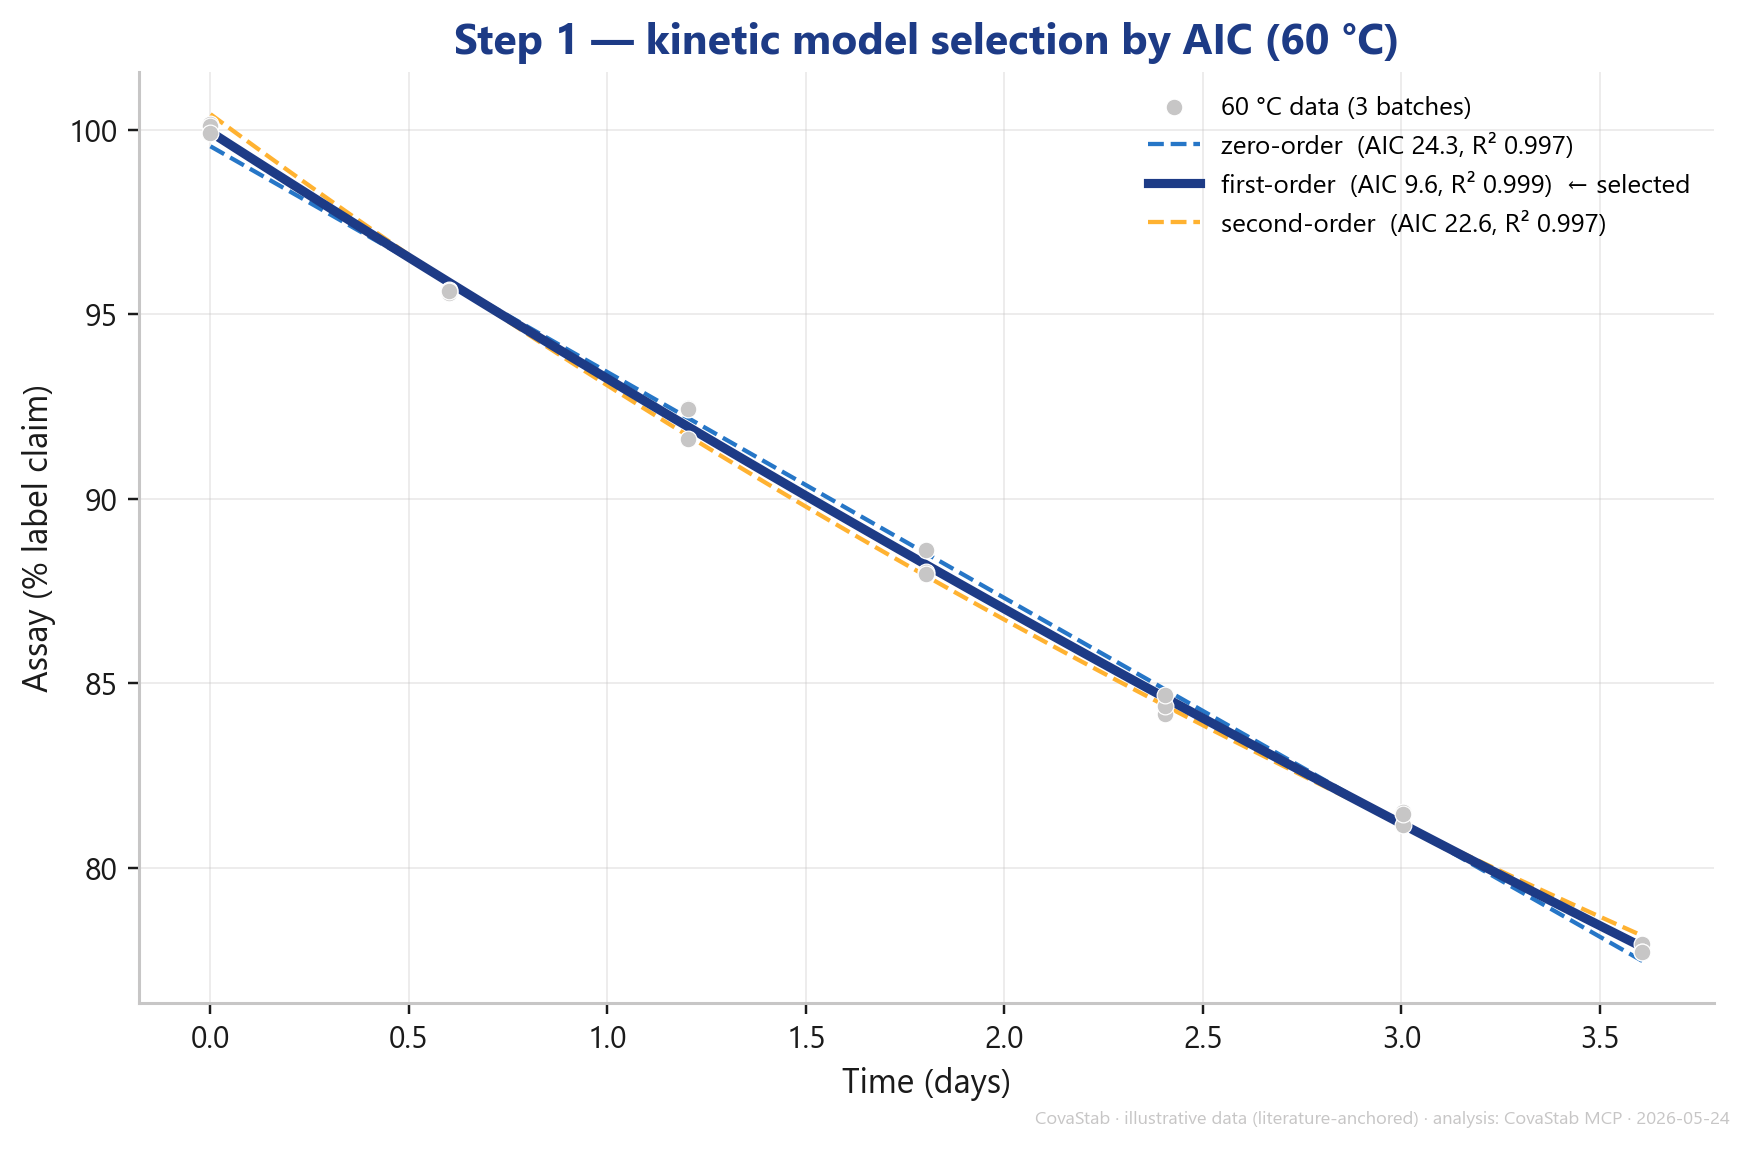
An important side point that builds trust: at the small degradation extents that matter for shelf life (< 10%), the three orders are practically indistinguishable: which is exactly why the robust extrapolation is valid here.
Step 2: The Arrhenius fit
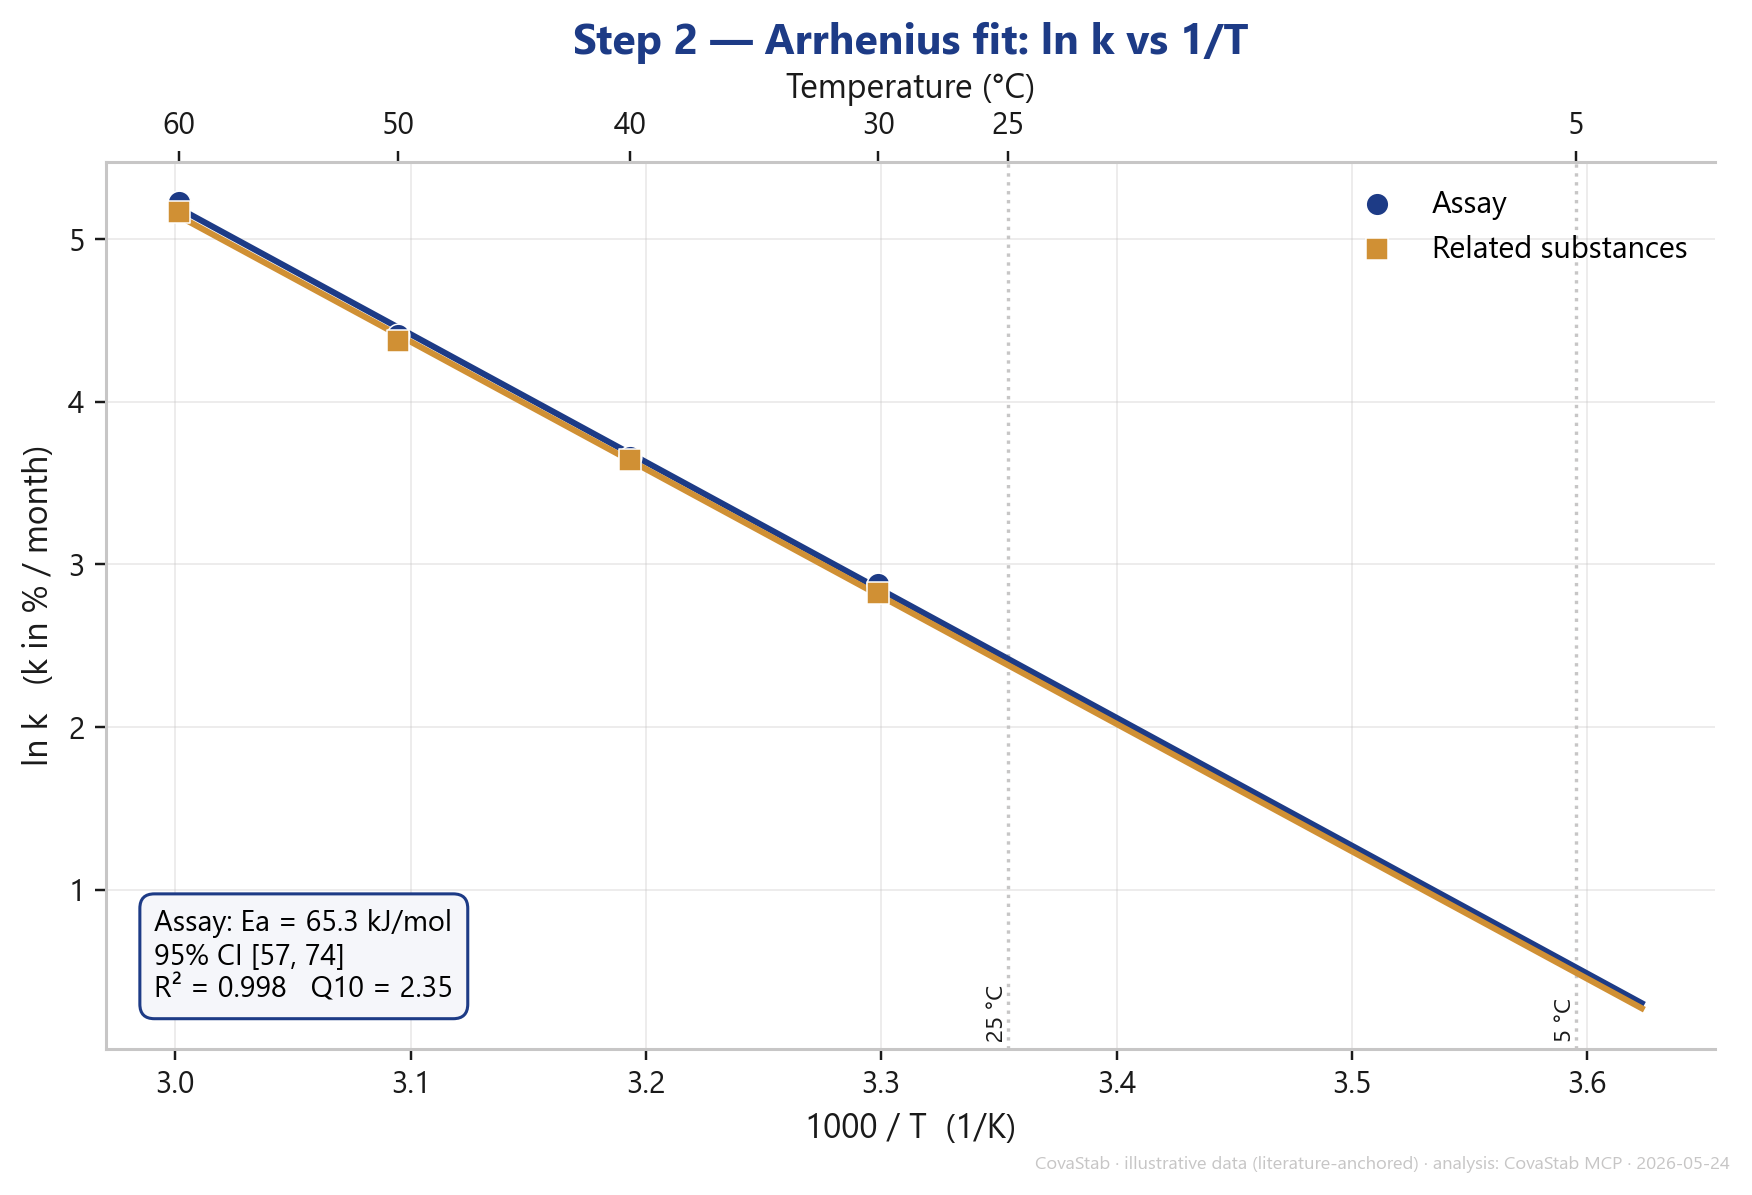
The degradation rates of the four temperatures sit on a straight Arrhenius line (ln k vs 1/T). The slope yields the activation energy Ea ≈ 65 kJ/mol (95% CI 57 to 74), with R² = 0.998 and a Q10 ≈ 2.35, meaning the rate falls by a factor of about 2.35 for every 10 °C of cooling.
The four rates per temperature:
- 30 °C: k(assay) 17.84%/month · k(related substances) 16.82%/month · R² = 0.9976
- 40 °C: 38.79 · 38.12 · 0.9948
- 50 °C: 82.30 · 79.23 · 0.9991
- 60 °C: 186.32 · 175.04 · 0.9968
Notable: assay and the limiting degradation product share practically the same Ea (65.35 vs. 65.12 kJ/mol). That confirms a single dominant mechanism is at work: exactly the precondition under which the Arrhenius extrapolation is valid in the first place. (More in the honesty block.)
Step 3: The prediction, and the non-obvious limiting parameter
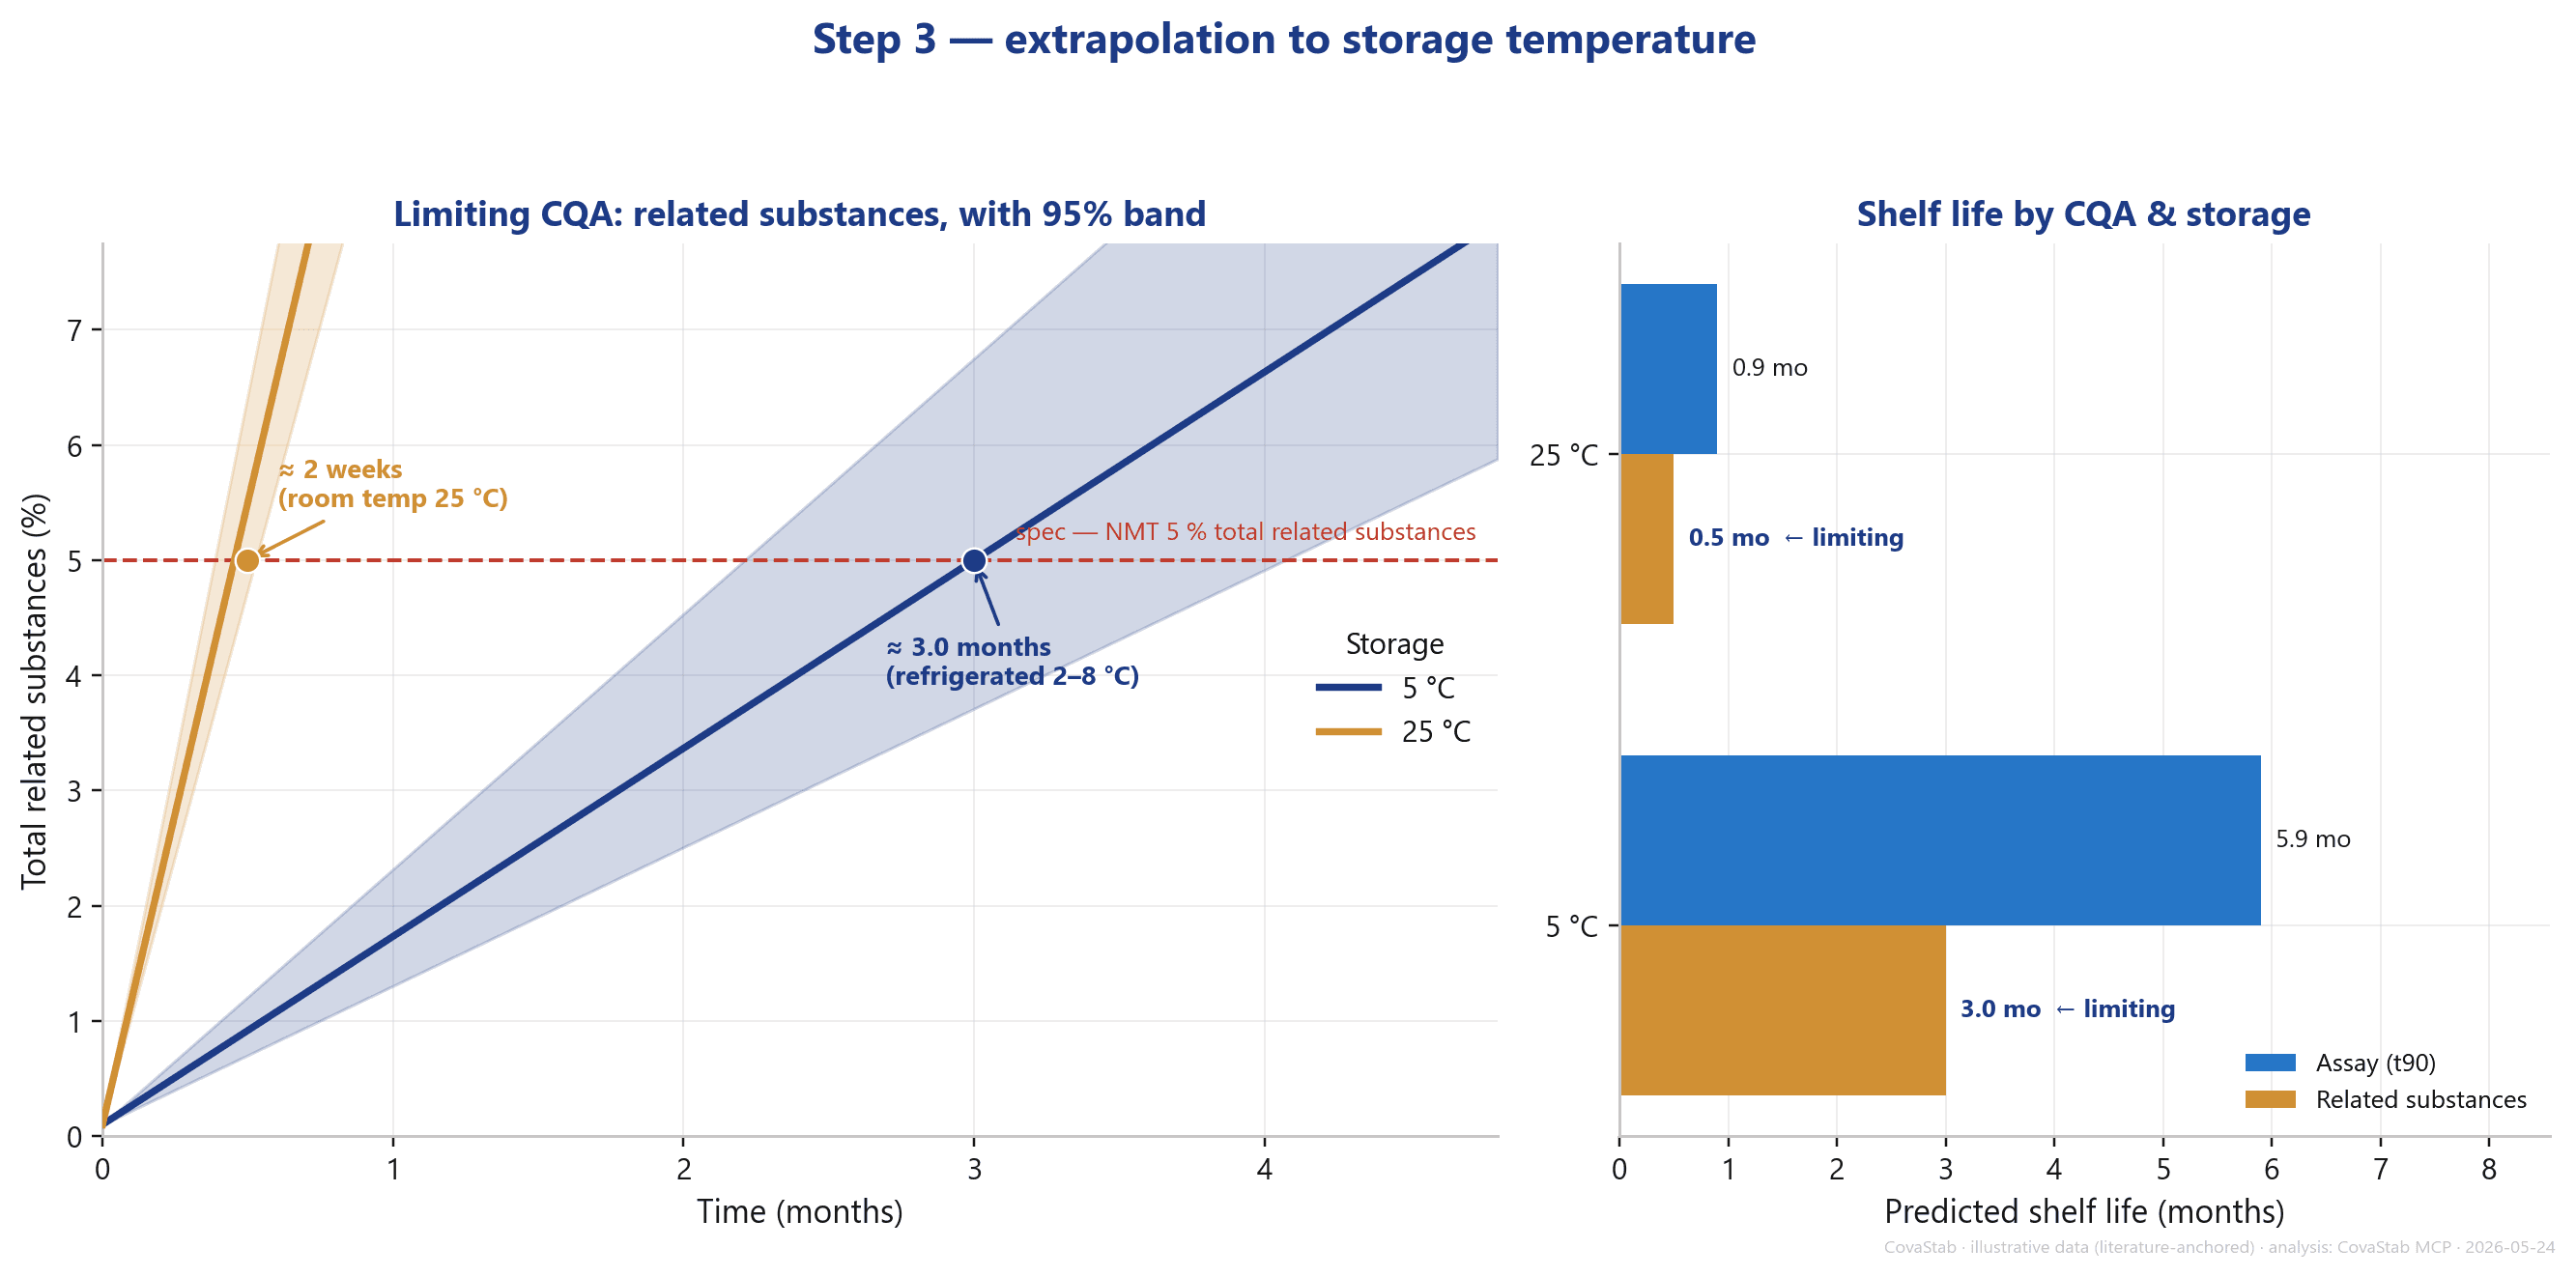
Reading the Arrhenius line down to the storage temperature gives shelf life: about 3 months refrigerated (2 to 8 °C) versus only about 2 weeks at room temperature (25 °C): with a confidence band that widens with the extrapolation distance. That alone illustrates clearly why the product must be stored refrigerated.
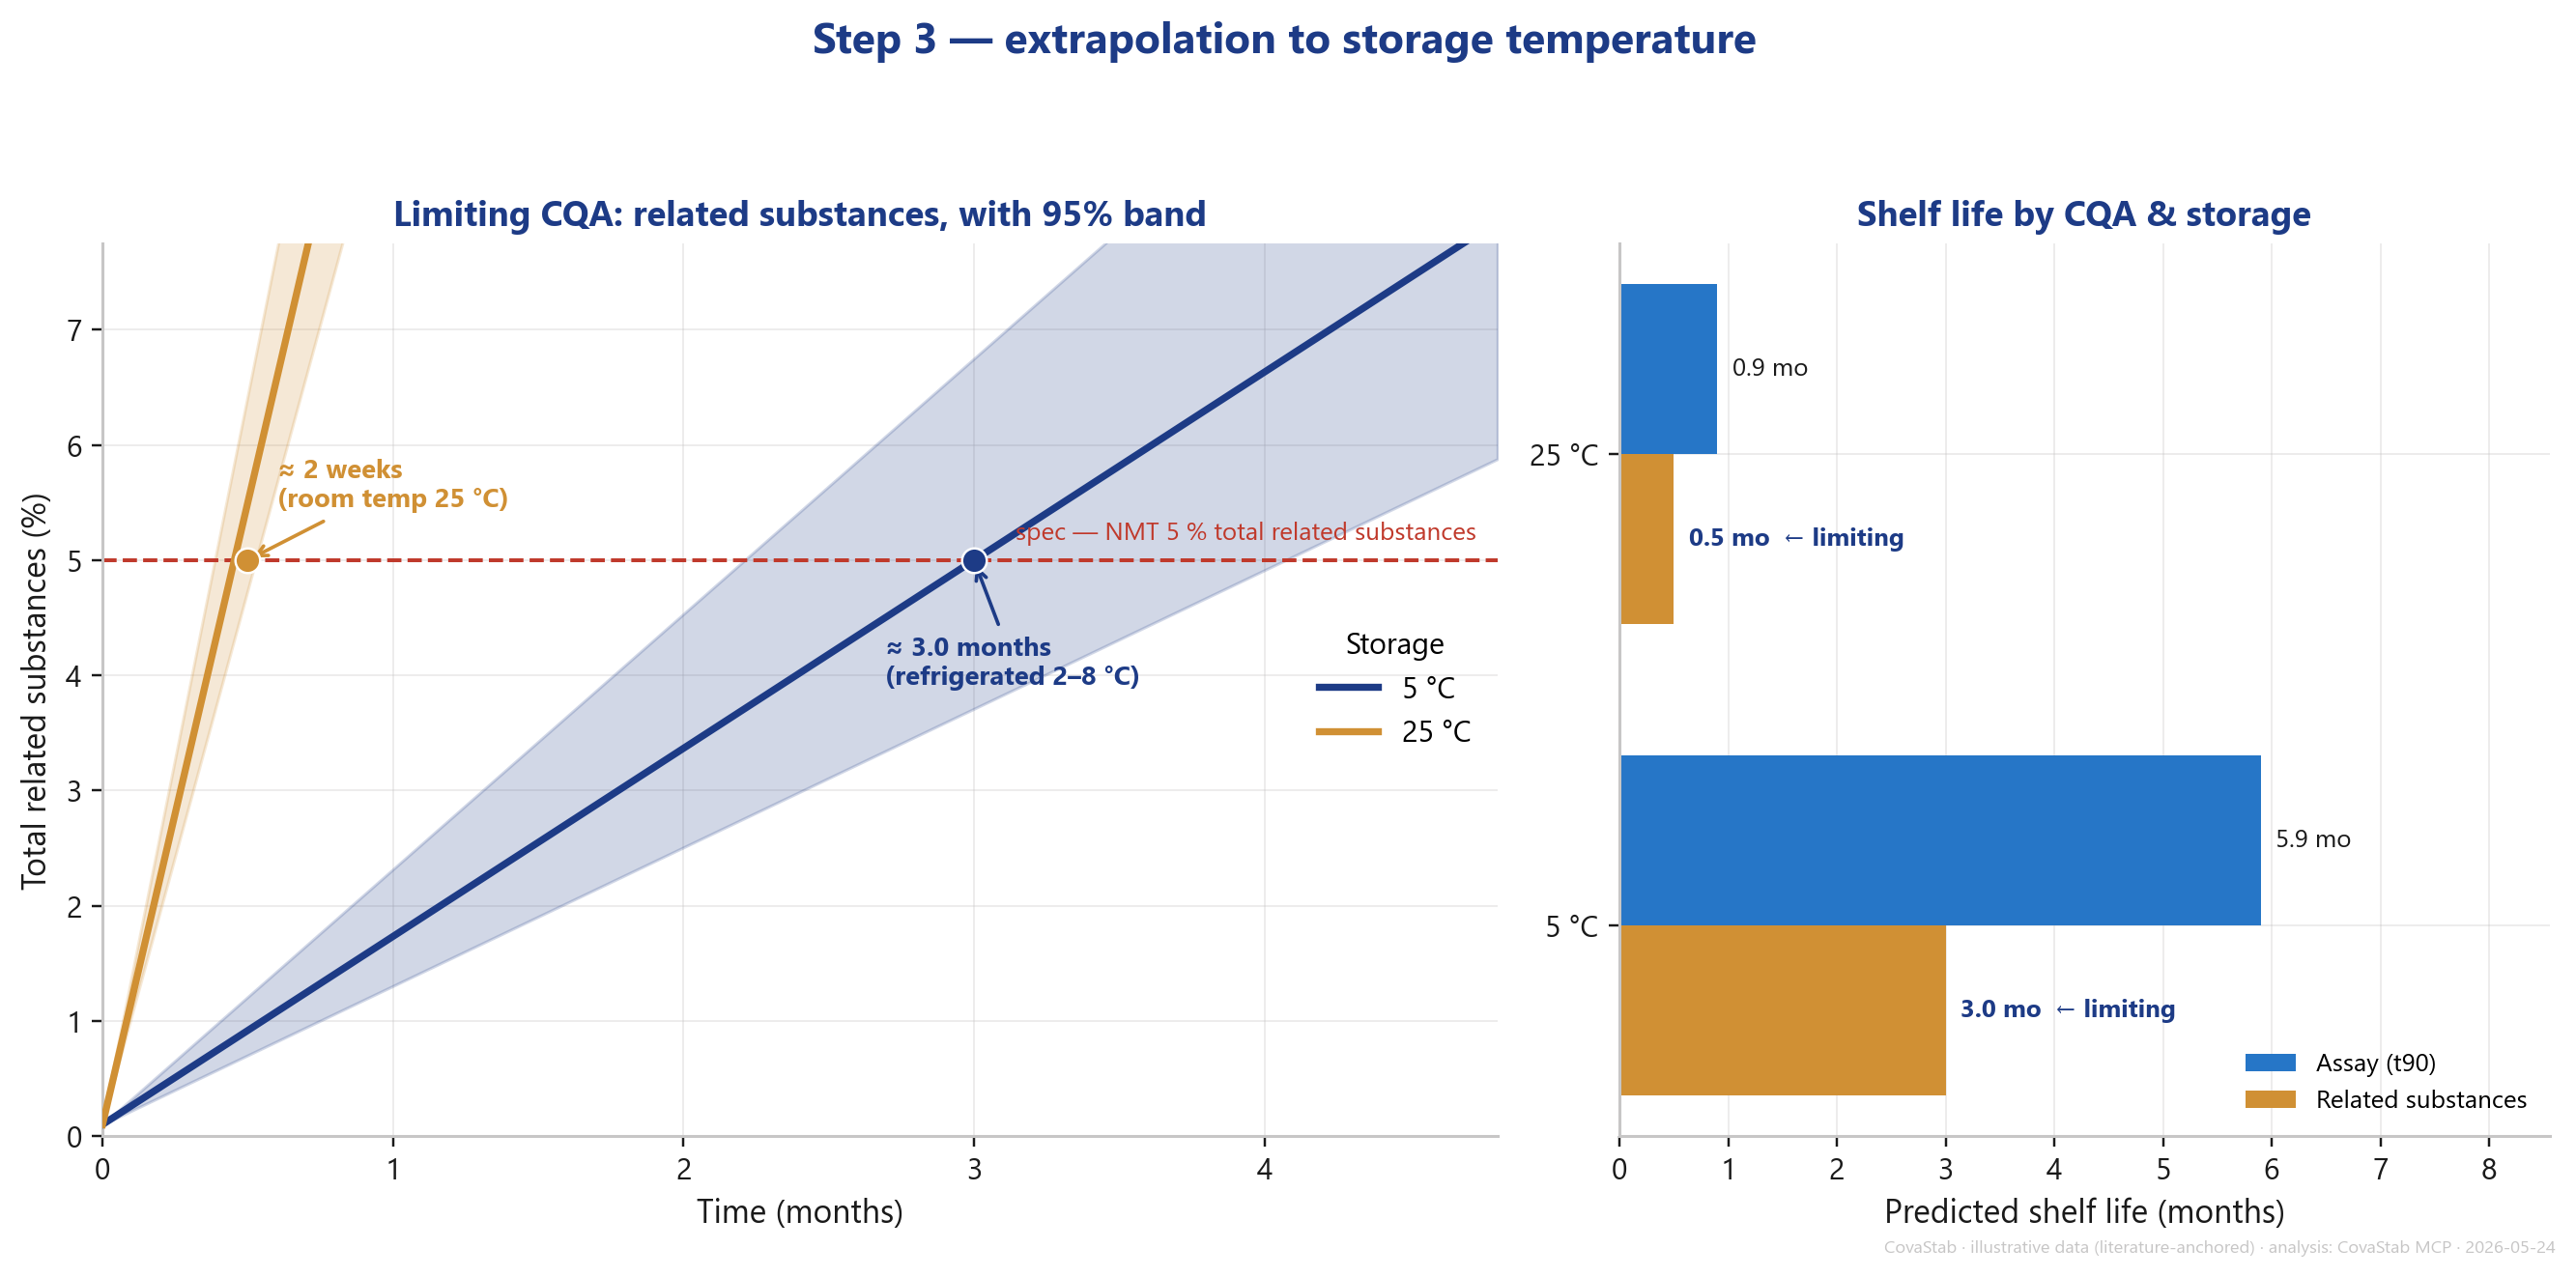
The actual teaching point sits in the detail. Following both critical quality attributes: assay (lower limit 90%) and total related substances (upper limit 5%): shows:
- Assay → t90 = 5.9 months at 5 °C, 0.9 months at 25 °C
- Related substances → t = 3.0 months at 5 °C (CI 2.21 to 4.07), 0.5 months at 25 °C
The degradation product reaches its 5% limit considerably earlier (3.0 months at 5 °C) than assay falls to 90% (5.9 months). The limiting parameter is therefore the degradation product, not assay. Anyone looking only at the "obvious" drug content overestimates shelf life by almost a factor of two. Exactly these non-obvious dependencies are the reason to compute a full CQA picture rather than trust a single curve.
Step 4: Right-size the confirmatory study too
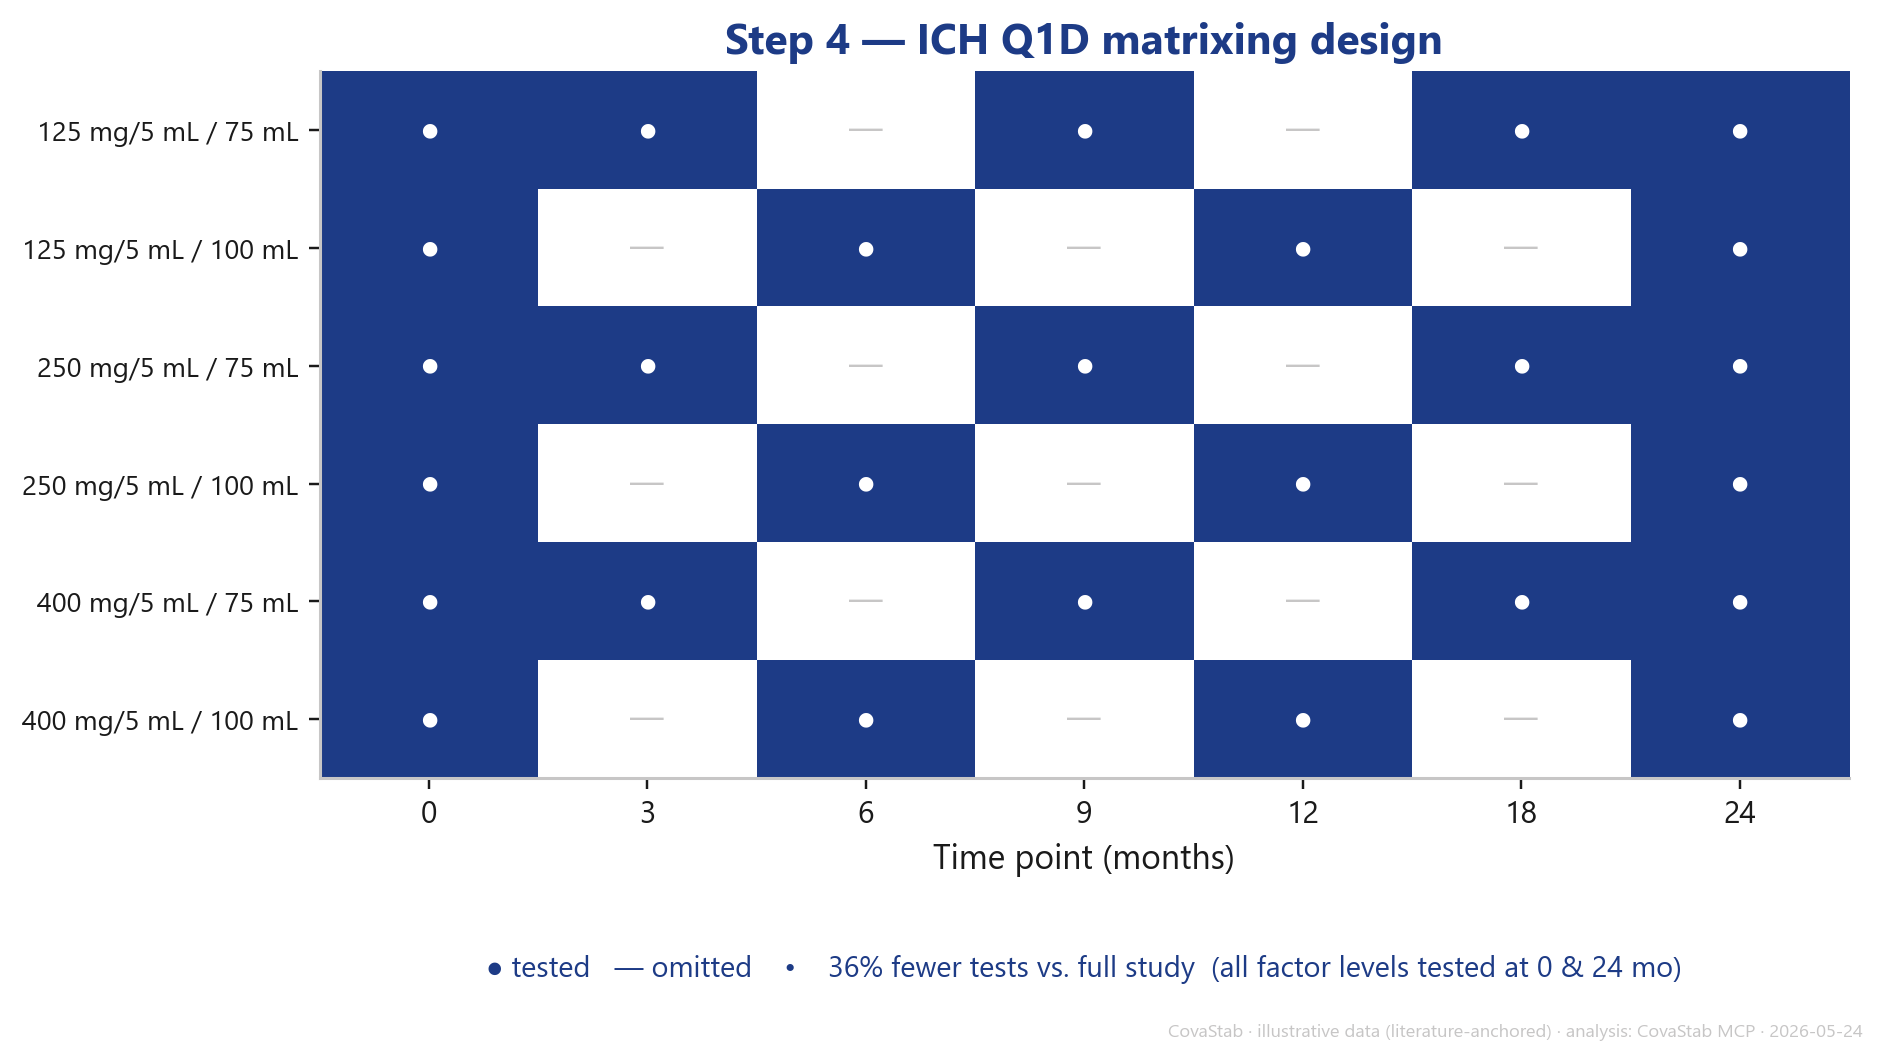
The prediction also dimensions the real-time study that confirms it. An ICH Q1D matrixing design tests every strength × pack combination at the start and end (0 and 24 months), but only a fraction of intermediate pulls: here 36% fewer test points than full testing, without loss of design balance. Fewer analytical runs, same regulatory coverage.
The result: and where the honest limit sits
In minutes a complete picture stands: kinetic model, activation energy, predicted shelf life per storage temperature, the limiting CQA and a reduced confirmatory design. That focuses chamber time on the promising candidates instead of burning it broadly.
And here comes the point that makes this use case honest: CovaStab reports a significant change at the 40 °C point (assay loss > 5%). For a refrigerated product like this one, though, the accelerated condition under ICH Q1A(R2) is 25 °C / 60% RH, not 40 °C, so read the 40 °C finding as a warning signal from the temperature series rather than as the formal Q1A criterion. Either way the formal shelf life must come from the real-time / long-term study at 2 to 8 °C: accelerated extrapolation alone is not regulatorily sufficient. The tool raises that warning itself. That is exactly the value: it delivers not just a number but also the honest signal of when not to rely on that number alone.
Honestly placed
(1) Arrhenius assumes a single dominant degradation mechanism: true here for β-lactam hydrolysis, but not universally (oxidation, solid-state, moisture-driven or multi-pathway degradation can break the straight ln k vs 1/T line). (2) The stability data are illustrative and literature-anchored, not measurements; the CovaStab analysis itself is real. (3) Significant change is observed at the 40 °C point; for a refrigerated product the accelerated condition under ICH Q1A(R2) is 25 °C, and regardless of that the real-time study remains the regulatory basis; the prediction de-risks and prioritizes, it does not replace. (4) The extrapolation uses a zero-order rate model; at the < 10% degradation relevant to shelf life this is statistically indistinguishable from the selected first-order model. (5) "AI" here means the orchestrating agent / MCP layer that runs and interprets these classical kinetic models: Arrhenius and the ICH statistics are deterministic, not machine learning.
Try it yourself
You can run the same chain for your own accelerated data: model selection, Arrhenius fit, shelf life per storage temperature and a reduced study design, directly in the agent. Available on the free tier. → See CovaSyn MCP
FAQ
How do you predict shelf life from accelerated data?
Measure the degradation rate at several elevated temperatures, select the kinetic model (by AIC), fit the Arrhenius equation (ln k vs 1/T) and extrapolate the rate to the storage temperature. The extrapolated rate and the specification limits yield the predicted shelf life.
What is a good activation energy for shelf life?
For many pharmaceutical degradation reactions Ea sits in the range of about 50 to 150 kJ/mol; β-lactam hydrolysis at ~60 to 70 kJ/mol is consistent with this. A Q10 around 2 to 3 means the rate falls by a factor of two to three per 10 °C of cooling.
Why is the limiting parameter not always assay?
Because a degradation product can reach its upper limit faster than the active content falls below its lower limit. In the amoxicillin example total related substances (3.0 months) is limiting, not assay (5.9 months): looking at assay only overestimates shelf life.
Does Arrhenius prediction replace the real-time stability study?
No. It prioritizes and de-risks formulations early. If significant change appears at the accelerated condition (25 °C for refrigerated products, otherwise 40 °C), under ICH Q1A(R2) the real-time / long-term study determines the formal shelf life.
Is this "AI"-based shelf-life prediction?
The calculation itself: Arrhenius kinetics and ICH statistics: is classical and deterministic, not machine learning. "AI" here refers to the agent layer that runs, chains and interprets these models over MCP.
Methodology and data
Product: amoxicillin powder for oral suspension, reconstituted (50 mg/mL), storage 2 to 8 °C; degradation via β-lactam hydrolysis. Accelerated data: 30/40/50/60 °C, 3 batches (illustrative, literature-anchored, Ea ~60 to 70 kJ/mol: not measurements). Analysis by the CovaStab engine: model selection by AIC (first order, R² 0.999), Arrhenius fit (Ea 65 kJ/mol, CI 57 to 74, R² 0.998, Q10 2.35), extrapolation to 5/25 °C, significant-change check (ICH Q1A), reduced study design (ICH Q1D matrixing, 36% reduction). CQAs: assay (NLT 90%), total related substances (NMT 5%). Data snapshot: 2026-05-24.